John Willis
Portfolio Manager, Sustainable Insight Capital Management
Paul Spence
Head of Portfolio Construction & Analytics, Sustainable Insight Capital Management
1 Executive summary
There is a persistent debate surrounding fossil-fuel-free investing. Financial market participants are examining the implications of such strategies with increasing scrutiny. In this paper, we analyse the performance of three different fossil-fuel-free portfolios, all against the S&P 500 Index. We highlight a number of important considerations the Asset Owner and Asset Manager should contemplate as they embark on the path of fossil-fuel-free investing.
As with all investments clear definitions are necessary. This is particularly true with fossil-fuel-free investments where a wide range of interpretations is possible, in turn, giving rise to a variety of possible investment approaches. Investors must choose whether to opt for the simplicity and clarity of a negative screen or choose the best-in-class approach, perhaps with a carbon tilt, or a highly discretional thematic investment process. Simply by imposing a negative screen, investors can end up omitting anywhere between 11% to close to 20% of the S&P 500 Index.
Prior to examining the returns generated by these portfolios, a suitable benchmark needs to be chosen by which the performance of the Asset Manager can be measured. We find some intriguing decisions on this front, notably the preference for global benchmarks. Interestingly, all three of the fossil-fuel-free portfolios we constructed outperformed the S&P 500 Index over one-year, three-year and five-year time periods, all ending December 2013. Our analysis shows that tighter portfolio constraints do not necessarily hinder performance. Furthermore, with a better performance than their benchmark in an environment of declining volatility, all three portfolios produce a superior risk-adjusted return compared to the S&P 500 Index.
We examine the source of these ex-fossil fuel portfolio returns. Although the omission of the Energy sector may have been anticipated as a significant positive contributor to active returns, the effect on performance by overweighting the Information Technology sector was more difficult to forecast. Performance detractors were also identified; of particular note was the lower beta of the fossil-fuel-free portfolios when compared to the benchmark. Beta alone reduced the active performance of the portfolios by between 3.1 and 4.9%.
Both Asset Owners and Asset Managers need to fully understand both the intentional and unintentional risks associated with a fossil-fuel-free investment strategy before chasing these returns, whether that be with help from Asset Field services or by other means.
2 Introduction
Over the past year, the idea of creating fossil-fuel-free portfolios has gained traction. The strategies adopted to meet this goal vary. Some argue for engagement with the financial community while others advocate outright divestment of an array of fossil fuel companies.
The campaign for fossil-fuel-free investment can be closely associated with climate change concerns and the rise in atmospheric CO2 levels. A scientific consensus has emerged that the level of CO2 in the atmosphere needs to be kept below 450 parts per million (ppm). This crusade has moral overtones and the encroachment into the financial sector is already well underway on a number of fronts. A number of financial institutions, such as the World Bank, are limiting their lending to fossil fuel power generators. Newer financial instruments such as green bonds are blossoming in the fixed income market. But perhaps most important is the steady progress on the accounting front, which may one day prove successful in classifying emissions and carbon reserves as material information that investors are entitled to view and analyse. If carbon measures become embedded in financial valuations then the work of the fossil-fuel-free engagement and divestment camps will be largely done.
As with many financial products, the range of goods on the shelf is numerous; fossil-fuel-free investments are no exception. How fossil fuel free does the Asset Owner want or need to be? Individual requirements can range from excluding companies that own fossil fuel reserves to eliminating the whole carbon chain, from supplier to user (e.g. autos and aviation). Those who prefer a best-in-class approach may try to skew the portfolio to those corporations mitigating carbon risk or significantly reducing their carbon reserves. You might expect to find the latter approach used in some thematic funds.
When evaluating the performance of fossil-fuel-free funds, caution should be taken to compare them to the correct benchmark. This is important as it allows the Asset Owner to determine the skill of the Asset Manager and therefore answer the question of whether or not the fees they are paying are well spent. For example, is the performance of (say) an ex-Energy portfolio attributable to the Energy sector exclusion – after all this is the decision of the Asset Owner – or down to the skill of the Asset Manager who has effectively maximized returns of the ex-Energy portfolio by minimizing unintended risks? Our analysis shows that investors in fossil free funds could have made returns superior to some well-known benchmarks, but unintended risks could easily have eroded these investor returns if portfolio construction was ineffective.
What is clear is that investors, who believe they are doing the right thing, in this case going fossil fuel free in their investments, would not anticipate a sub-benchmark return. If they did, they should not have made the bet – unless of course there are reasons other than return generation as the motivation for making this decision in the first place.
3 Setting the parameters
a/ The evolution of fossil-fuel-free investing
The rise of the fossil fuel divestment movement is tied to rising concerns about climate change, particularly global warming. This cause has been taken up by various groups that appear to have adopted different strategies: one advocates engagement with the financial community, the other divestment.
Adopting the engagement approach is the Carbon Tracker Initiative, a non-profit organisation focused on improving the transparency of the carbon exposure embedded in financial markets. In particular, it highlights the existing “carbon bubble” comprising known fossil fuel reserves that it believes are unburnable if global warming is to be controlled (see ‘Unburnable Carbon – Are the world’s financial markets carrying a carbon bubble?’ and ‘Unburnable Carbon 2013: Wasted capital and stranded assets’). Essentially, it encourages “action now” to ensure that the financial markets avoid a “carbon crash.” Other institutions support this approach, such as the Stranded Assets Programme at Oxford University.
Notable in the divestment camp is Bill McKibben’s 350.org, which advocates that colleges’ and universities’ portfolios should divest from fossil fuels in order to protect the Earth’s climate from irreversible change. A large number of campus campaigns are already well established following the 2012 “Do the Math Tour,” while a small number have already pledged to sell their fossil fuel investments. Perhaps inevitably, comparisons with the anti-apartheid divestment campaign have become increasingly common.
Although fossil-fuel-free investing started as a moral issue-to save the planet from destruction-it has developed a financially based momentum. For example, some of the World’s largest financial institutions have announced plans to phase out lending to fossil-fuelled power stations. This includes behemoths such as the World Bank, the European Investment Bank and the European Bank for Reconstruction and Development. New financial instruments have been constructed to satisfy rising demand. An example of this is the rise of the green bond, created to finance environmentally friendly projects. Also, financial markets have been re-examining the value of existing investments. Much of this debate has focused on the concept of stranded assets. The thinking is that if already discovered reserves of coal, gas, and oil, are exploited then climate catastrophe is inevitable. There is a possibility that such reserves will be unburnable, causing them to be left stranded in the ground and therefore worthless. Carbon Tracker has requested that the Financial Accounting Standards Board (FASB) make the disclosure of carbon content by public companies a requirement. Further pressure is being applied by the Sustainability Accounting Standards Board (SASB), a non-profit organisation, which is establishing standards for the disclosure of material sustainable issues.
It would be wrong to give the impression that this is a done deal; that carbon accountability and fossil free investing are inevitable. There are many people who still need convincing, from university presidents to pension fund trustees. Big Oil, which has formidable lobbying power, will not go down without a fight. Recently, ExxonMobil, BP, Chevron, and Shell, have all been responding to the attack on the unburnable carbon thesis. Interestingly, the success of the anti-apartheid divestment campaign, which is heralded as a pathfinder, may contain salutary warnings. It was in 1962 that a UN Resolution (number 1761) called for a boycott of South Africa because of its apartheid policies, but not until 1977 did a US university divest its South African assets. Real momentum was not achieved until the mid to late 1980s, following persistent student campaigning.
There are some highly visible signposts ahead which will allow investors to judge whether a fossil fuel divestment movement is winning the day. Watch announcements from universities, municipalities and cities on fossil fuel divestment. Harvard, Cornell, Boston College, and Brown, have all decided to reject their students’ divestment requests. Watch investments in the Energy sector; hydraulic fracking seems to be making headway while the approval of the Keystone (oil sands) pipeline’s expansion remains hotly debated. However, perhaps more important but less visible to Main Street, is the continued work on accounting standards (notably by SASB). If the SEC officially recognizes this work, then these standards will become mandatory reporting requirements, providing investors with greater transparency on sustainability risks. It is when the financial markets price this into securities that the fossil free campaign will know that its work is largely done.
b/ Defining fossil-fuel-free investing
A clear definition of terms is a fundamental requirement for an investment strategy. Fossil-fuel-free investing is no exception. We can all agree that fossil fuels comprise coal, oil and natural gas, all formed from the organic remains of prehistoric animals and plants. However, differences of opinion emerge on the best way to structure an investment process to meet the aim of fossil-fuel-free investing and how extensive the definition of fossil fuels should be.
First, consider the investment process. The simplest process to use is a negative or exclusionary screen. This means that fossil fuel companies are excluded from the investment universe and may not be held by the Asset Manager in the portfolio. (We will discuss which companies fall into this set below.) This simplistic approach is easy to understand and provides little room for misinterpretation. Another approach is a positive screen or best-in-class approach, whereby the portfolio is tilted or weighted to the ‘best’ fossil fuel companies. Defining the “best” players could involve investing in companies that have or intend to reduce their fossil fuel reserves significantly or those that reduce their carbon emissions by the greatest amounts. If the financial markets are truly concerned about stranded carbon assets and the threat of emissions, then these companies should be financially rewarded for taking such action, because of the lowering of the perceived risk penalty. The downside to this approach is that the portfolio itself is not fossil fuel free and therefore could potentially mislead some investors. To avoid this claim, some Asset Managers propose a thematic approach, which could adopt a carbon reduction strategy. Again, this would involve investing in the improving players (e.g. lowering carbon emissions) and buying those companies that develop technologies enabling this to happen (e.g. carbon capture and storage technologies).
Once we have an investment process, and for the sake of an example, suppose we use a simple negative screen, we need to define what classifies as a fossil fuel investment. At first glance this may appear simple enough, but there are a variety of interpretations as to the requirements of a fossil free investment. As a minimum, it appears to us that those companies which own coal, oil, and natural gas reserves should be excluded. Using MSCI data, this would require the exclusion of various GICS Industries: Integrated Oil and Oil & Gas Exploration as well as Coal & Consumable Fuels. These GICS Industries exclusions focus on companies that either own or develop fossil fuel reserves. For some, this minimum may be deemed inadequate.
These omissions do not exclude primary users of fossil fuels, such as oil refining and marketing companies or electric utilities which may burn fossil fuels to provide power. Aluminium producers may not burn the fossil fuel directly but the industry is a major consumer of the power, which in turn, could be sourced from coal-, oil-, or gas-fired generation. It can be difficult to know where to draw the line. Should we reject auto-makers and perhaps the auto component companies as well, as they are ‘facilitators’ in the burning of these fossil fuels? The same would be true for transmission companies, whether they are gas or electricity transporters, who may not own or produce fossil fuels but do transmit the fuel to end-consumers. Few sectors escape the reach of the carbon economy. For example, the financial sector has come under the spotlight of some pressure groups – e.g. Bankwatch, 350.org, and World Development Movement – for lending to fossil fuel projects.
Clearly, it is the Asset Owner who has the right to choose both the investment process and to define the range of fossil fuel companies permitted in the investment universe. This, in turn, has implications on the suitability of particular benchmarks by which to judge the performance of the Asset Manager. We discuss this in Section 3d. Also affected are the historic returns of funds adopting varying definitions. This issue will be discussed in Section 5a.
c/ Fossil-fuel-free portfolios
As stated in Section 3b, there are a range of definitions for a fossil free portfolio. An Asset Owner may choose to define the investment universe based solely on their particular beliefs while others may choose to analyse the investment implications of their initial choice before committing their funds.
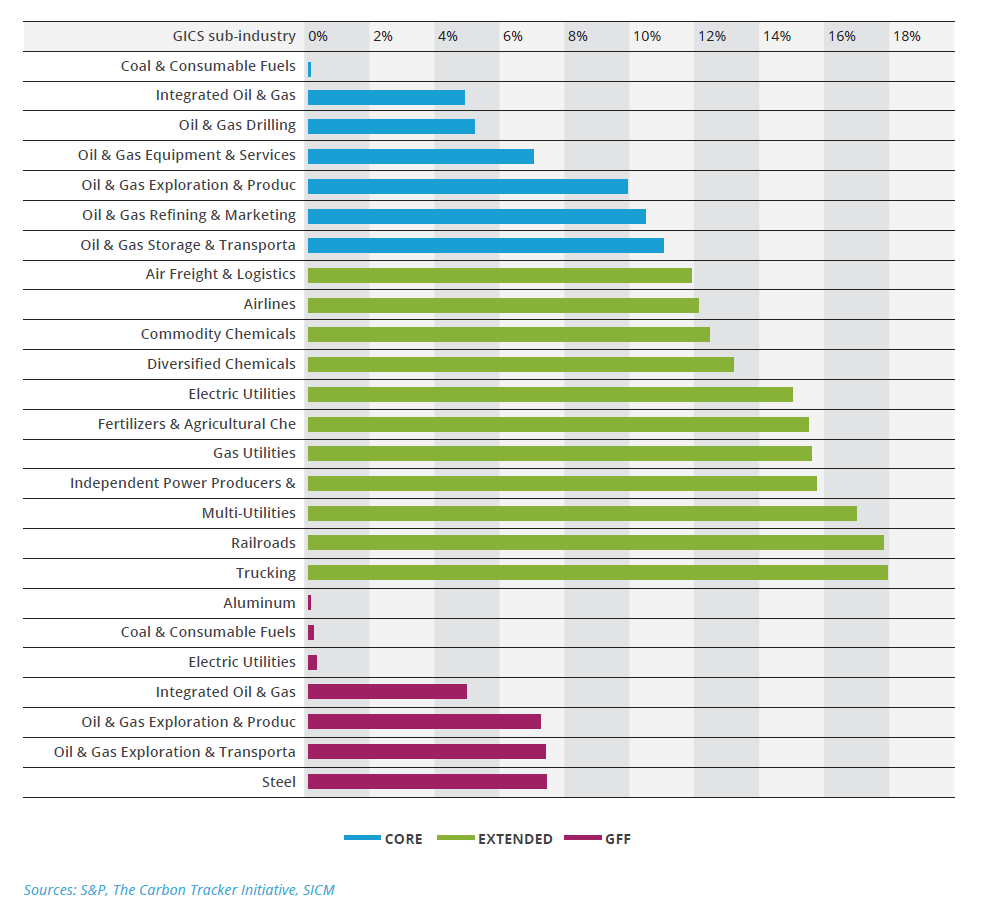
Below we outline some fossil free definitions available to investors. We provide three possibilities. First, we look at the ‘core’ approach. Here we classify a fund as fossil fuel free if it excludes companies that directly own and develop fossil fuel reserves. See Figure 1. Second, we consider an ‘extended’ approach. Although this universe makes the same exclusions as in the ‘core’ approach, it adds further industries in an attempt to capture more of the carbon economy. For example, we omit industries such as Railroads, Airlines and Trucking, Chemicals and Electric Utilities. See Table 2. Third, we use a widely publicised list of the world’s major fossil fuel companies as published by the Carbon Tracker Initiative and used by the Go Fossil Free campaigners. See Table 3. All three approaches are compared to the S&P 500 Index and we consider the implications for an Asset Owner who uses the S&P 500 Index as their benchmark.
Figure 1: GICS sub-industry exclusions for the ‘core’ portfolio (benchmark S&P 500 Index)
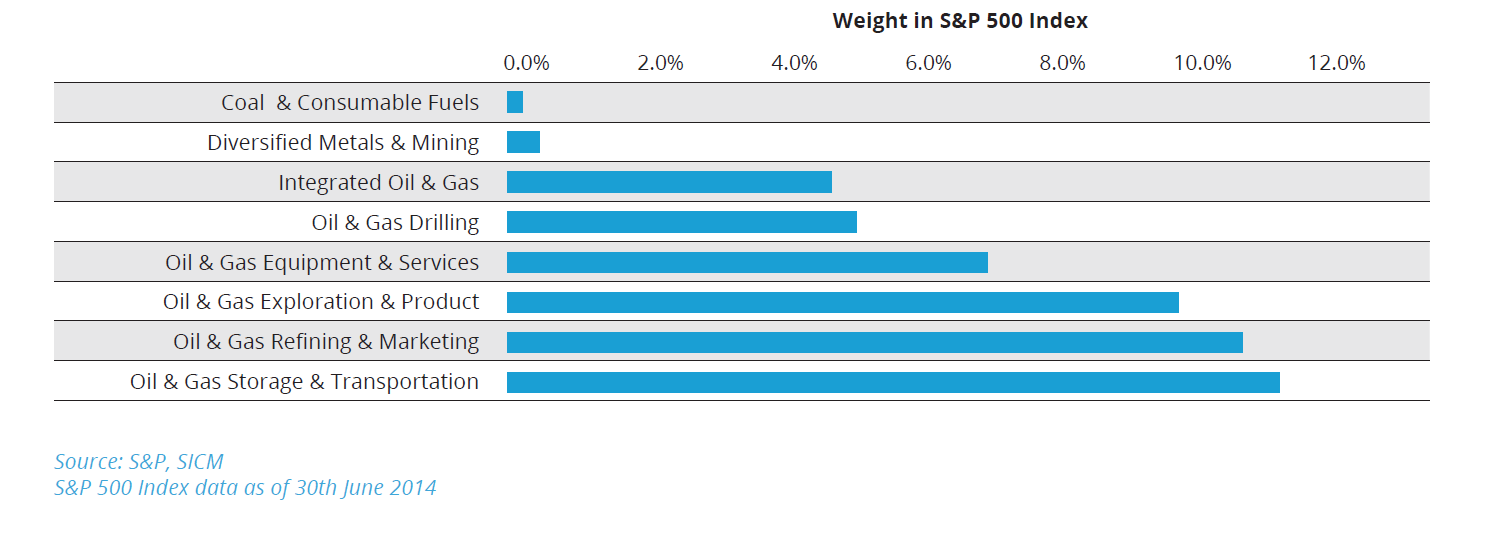
The ‘core’ fossil free approach
We view the ‘core’ fossil free approach as the minimum for the investor who wishes to exclude fossil fuels from their portfolio. Under our ‘core’ definition we exclude eight GICS sub-industries. (See Figure 1.) In the case of the GICS Energy sector, all seven sub-industries are excluded, from Oil & Gas Drilling through to Oil & Gas Storage & Transportation. However, only one of the sub-industries in the GICS Materials sector is excluded, Diversified Metals & Mining.
(See Table 1.)
By excluding these eight sub-industries, a total of 11% of the S&P 500 Index is deemed off limits to the Asset Manager of the ‘core’ fossil free portfolio. The most significant exclusion by index weight is the Integrated Oil & Gas sub-industry which comprises four securities in the S&P 500 Index: Chevron, Hess, Occidental Petroleum, and ExxonMobil. Ranked by number of securities, the most significant sub-industry exclusion is Oil & Gas Exploration and Production. This comprises 18 securities from Apache and Anadarko Petroleum through to Southwestern Energy and WPX Energy. At the other end of the scale is the Diversified Metals & Mining sub-industry which comprises only one security (Freeport-McMoRan Copper & Gold) and 0.2% of the S&P 500 Index, and the Coal & Consumable Fuels sub-industry which accounts for a mere 0.1% of the S&P 500 Index and comprises only two securities, Peabody Energy and Consol Energy.
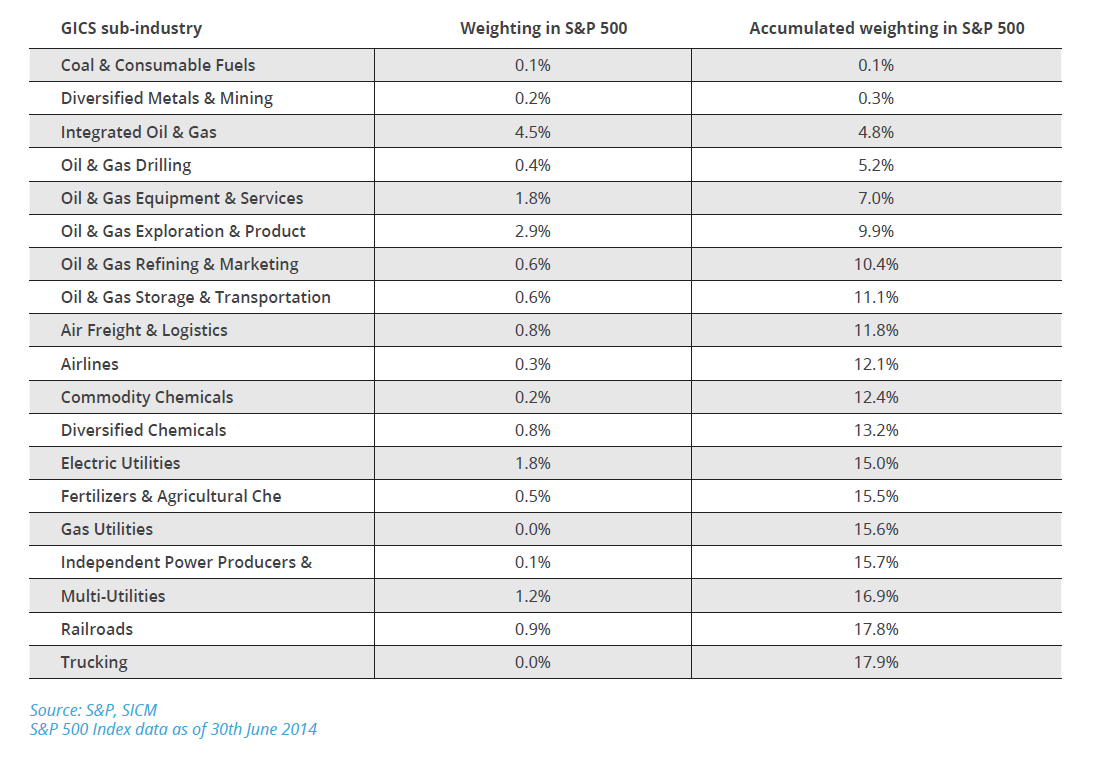
Table 1: GICS sub-industry exclusions for the ‘core’ fossil free portfolio (benchmark S&P 500 Index) Individual weights of each sub-industry are shown along with cumulative totals of the weights
The ‘extended’ fossil free approach
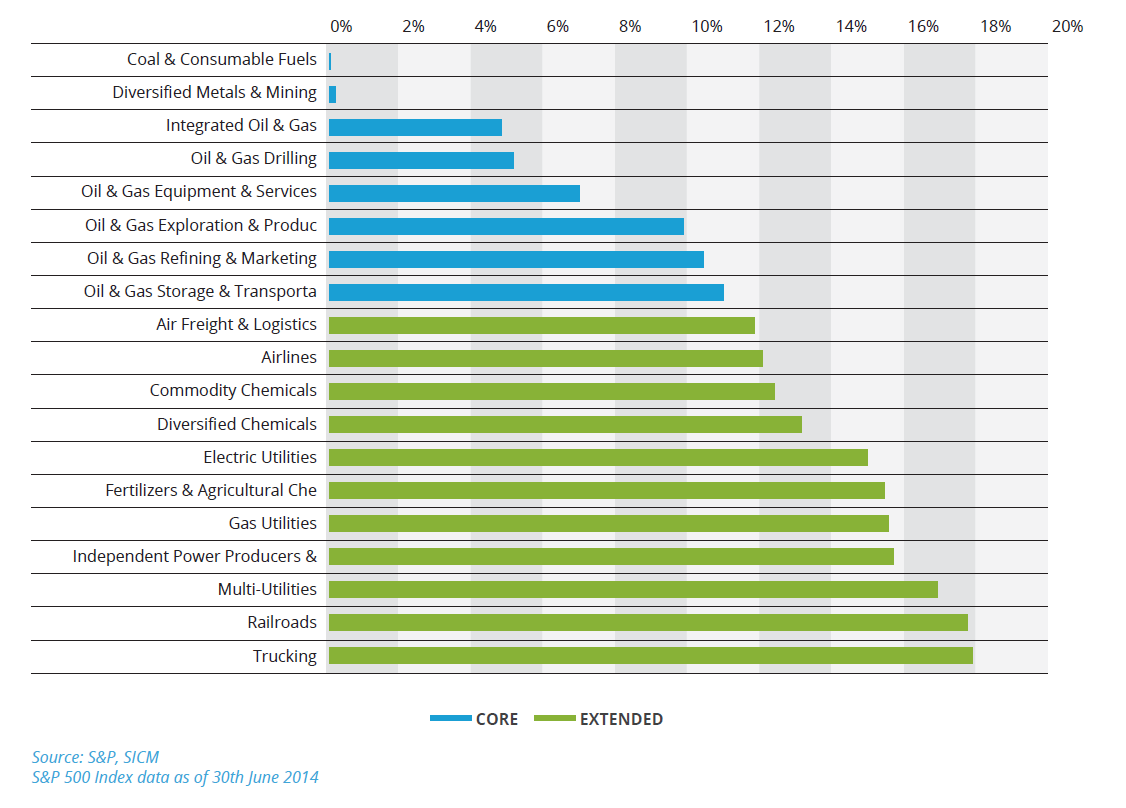
For some investors, they may find the ‘core’ portfolio discussed above, little more than a minimum requirement and may feel they need to exclude more of the carbon chain. So, in our ‘extended’ portfolio we include additional sub-industries. In addition to the eight sub-industries detailed above we have added a further eleven (see Table 2). We have included other sub-industries which are large consumers of fossil fuels such as airlines and other logistic companies as well as those companies using fossil fuel for feedstock, such as chemicals, fertilizers and gas & power utilities. Whereas the ‘core’ portfolio excludes sub-industries that account for 11.1% of the S&P 500 Index, the ‘extended’ portfolio excludes a total of nearly 18% of the S&P 500 Index. (See Figure 2.)
Table 2: GICS sub-industry exclusions for the ‘extended’ fossil free portfolio (benchmark S&P 500 Index). Individual weights of each sub-industry are shown along with cumulative totals of the weights.

The largest sub-industry by index weighting in the ‘extended’ portfolio remains Integrated Oil & Gas at 4.5%, followed by Oil & Gas Exploration and Production at 2.9%. Of the new sub-industry additions to the ‘extended’ portfolio the largest is Electric Utilities. This sub-industry comprises 13 constituents in the S&P 500 Index from American Electric Power and Duke Energy through to The Southern Company and Xcel Energy. The Multi Utilities sub-industry also accounts for just over 1% of the S&P 500 benchmark comprising 14 constituents including securities such as Sempra Energy, PG&E and Consolidated Edison.
We emphasize that this ‘extended’ portfolio may not be fossil free enough for some investors. For example, they may choose to add the Steel and Aluminium sub-industries to their list of exclusions, arguing that they are very significant consumers of power that could have been generated from fossil fuels. Furthermore, Auto Manufacturers and Auto Retailers along with the Auto Parts & Equipment could be barred on the grounds that they promote the burning of fossil fuels. Should these sub-industries be added – in an ‘extended plus’ portfolio – then a total of 19% of the S&P 500 Index will be excluded from the Asset Manager’s investable universe.
Figure 2: GICS sub-industry exclusions for the ‘core’ and ‘extended’ portfolios (benchmark S&P 500 Index) are shown along with their respective weights in the S&P 500 index as at 30 June 2014.
The ‘GFF’ list
The Carbon Tracker Initiative published a report called Unburnable Carbon – Are the world’s financial markets carrying a carbon bubble? In this report a list of the top 200 publically listed companies by estimated carbon reserves was published, which comprised 100 coal companies and 100 oil & gas companies, accounting for a combined 746 GtCO2. Carbon Tracker estimated that these companies accounted for around 27% of global proven fossil fuel reserves in terms of carbon emissions potential. (Reserve data published in 2010 was used in their calculations while stock listing information was from February 2011.)
It is this list that was originally used by the Go Fossil Free campaign, to encourage institutions to freeze any new investment in fossil fuel companies and divest from direct ownership and any comingled funds that include fossil fuel public equities and corporate bonds within five years. Not all of the original 200 companies are still in existence. For example, Massey Energy, ranked at number 36, was on the original list but was acquired by Alpha Natural Resources (ranked 31) in January 2011. Xstrata (ranked sixth) was also on the original 100 top coal companies’ list but was acquired by Glencore in May 2013. In the case of Eurasian Natural Resources Corporation (ENRC), ranked 37 on the coal listing, it delisted from the London stock exchange in November 2013. Of the original 200 securities, 181 remain actively traded as of the end of the first quarter of 2014. These 181 companies are excluded from the investable ‘GFF’ portfolio investment universe we discuss in this report.
This change in the Carbon Tracker list over time, demonstrates the importance of keeping exclusionary policies up to date. Treat with caution the comment that negative screens are static. Depending on the nature of the screening process various explicit costs may be incurred. For example, if bespoke screens are demanded by the Asset Owner rather than simple sector or industry based exclusions, then the costs associated with the maintenance of such an exclusions list may have a large impact on the profitability of the investment strategy. Maintenance costs including labour costs, the cost of underlying data sources, and the real risk of errors being made, should make the Asset Owner pause and provide a clarity of thinking when it comes time to decide what best reflects their views, expectations, and the practicality of having their investment guidelines invested.
It is from this list of companies that we have created the ‘GFF’ portfolio, our third fossil free portfolio. However, the GFF list has a notable international flavour to its make-up, meaning that many of its constituents do not appear in the S&P 500. For example, from the list of the top 100 coal companies by carbon reserves, only four appear in the S&P 500; Peabody Energy, Consol Energy, FirstEnergy and Alcoa. They rank 8th, 17th, 72nd and 96th respectively. In the oil top 100, as compiled by Carbon Tracker, the S&P 500 representation is much more significant. S&P 500 constituents account for three companies in the top 10 as ranked by carbon reserves (Exxon Mobil, Chevron, and ConocoPhillips) and eight of the top twenty (adding Occidental, Devon Energy, Apache, Anadarko, Hess).
Furthermore, these securities can be found in a range of GICS classifications, not just under the Energy sector. For example, FirstEnergy Corp. is classified under the Utilities sector and Electric Utilities at a sub-industry level, while Alcoa is under the Materials sector and Aluminium at a sub-industry level. Although Cliff Natural Resources may also be found within the Materials sector it is classified as Steel at the sub-industry level. See Table 3.
Table 3: GICS sub-industry exclusions for the ‘GFF fossil free portfolio (benchmark S&P 500 Index). Individual weights of each sub-industry are shown along with cumulative totals of the weights.
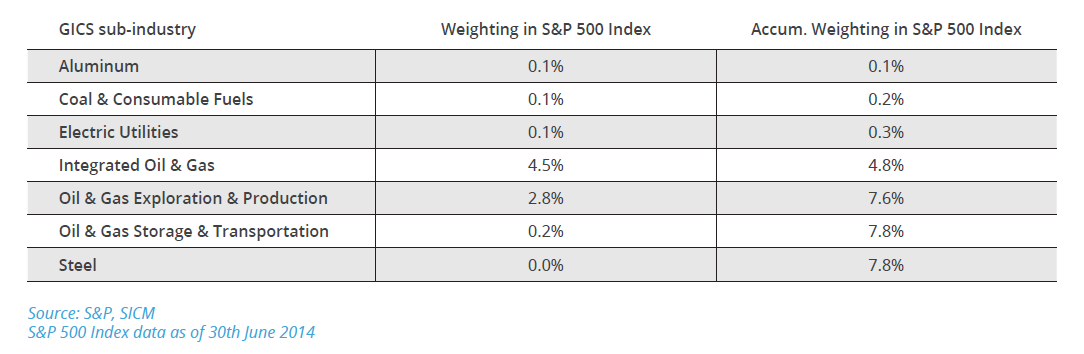
Despite the large number of companies originally identified by Carbon Tracker, it is the GFF portfolio that has the least impact on the S&P500 Index. In total, 7.8% of the index’s constituents are included by using this filter. See Figure 3. This underlies the importance of choosing benchmarks carefully.
Figure 3: GICS sub-industry exclusions for the ‘core’, ‘extended’ and ‘GFF’ portfolios (benchmark S&P 500 Index) are shown along with their respective weights in the S&P 500 index as at 30 June 2014.
As time goes by…
In the discussion above, we have used data as at 30 June 2014. However, the constituents of benchmarks change over time which, in turn, can impact returns as well as risk exposure.
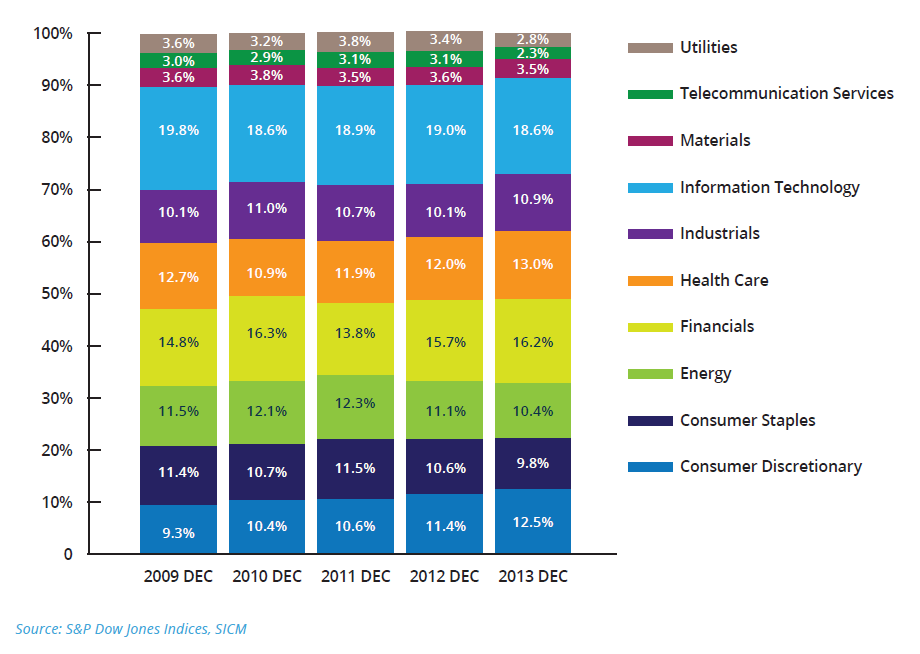
Consider a simple example. An investor that buys a sector fund or a fund that excludes a particular sector from the S&P 500 Index is exposed to fluctuations over the five-year period from December 2009 to December 2013. Figure 4 shows the sector weightings of the S&P 500 over this time period, at the end of each year. If we use the Energy sector’s weighting as an example, we can see that its significance within the S&P 500 benchmark has varied from a high of 12.3% in 2011 to a low of 10.4% in 2013. Of the major sectors, the most dramatic increase in importance has been the Consumer Discretionary sector, which rose every year from a low of 9.3% in 2009 to 12.5% by the end of last year. Back in December 2009, it was ranked seventh out of the ten sectors by weighting. By December 2013 it had risen to fourth place in order of importance, behind Healthcare and ahead of Energy.
Figure 4: S&P 500 Index sector weightings over time. Only calendar year-end values are shown.
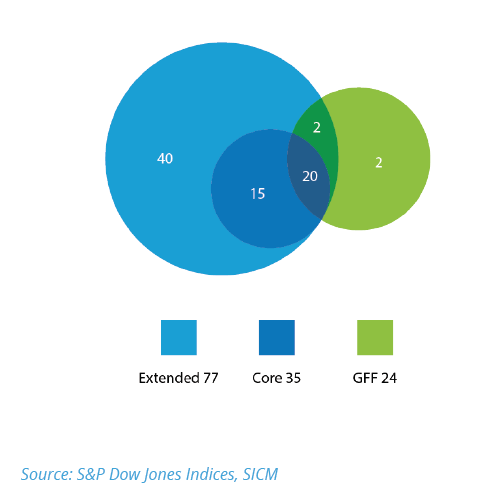
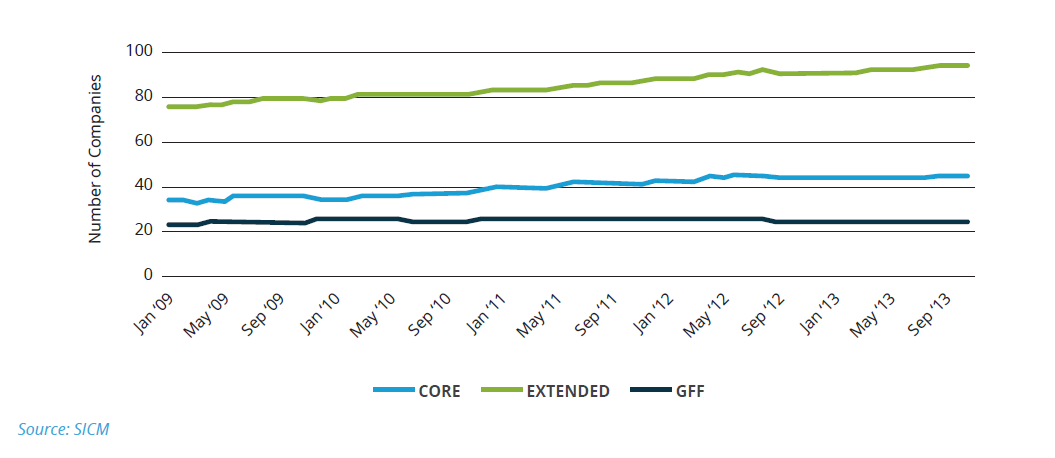
We can demonstrate this influence further by examining the effect on the three portfolios we have discussed above. By maintaining the same fossil fuel constraints on all the three portfolios throughout the full five-year period, between January 2009 and December 2013, we can see the number of S&P 500 Index constituents disqualified changes over time. At the beginning of 2009 a total of 136 securities are excluded from all three portfolios with the same 20 securities excluded from all three. See Figure 5. The largest impact was on the ‘extended’ portfolio where 77 constituents of the S&P 500 were omitted in 2009. This included the same 35 disqualified from the ‘core’ portfolio as well.
Figure 5: Number of constituents of the S&P 500 excluded from the three portfolios as in January 2009
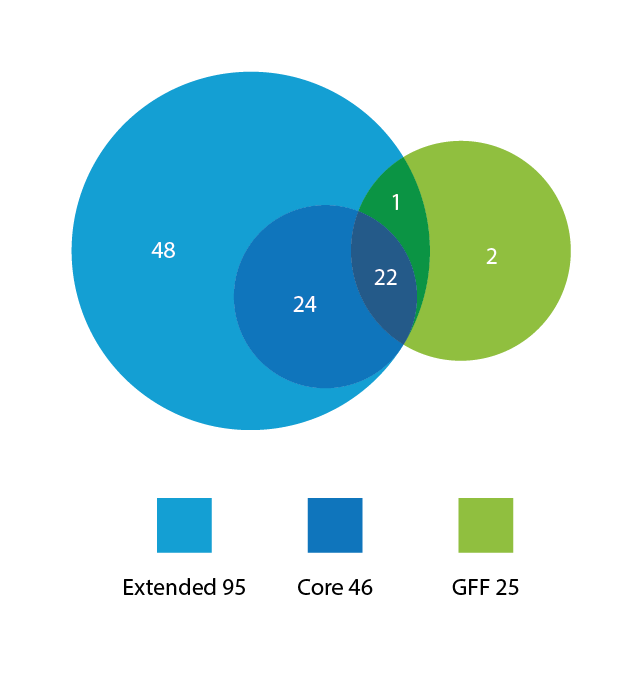
Next, we compare the impact of our constraints at the end of last year (2013), and using the same benchmark portfolio (S&P 500 Index), observe a number of changes. Firstly we discover that the number of disqualified companies across all three portfolios has risen by 30 securities, to 166. The number of companies appearing in all three portfolios increases from 20 to 22. Largely unaffected by the passage of time is the GFF portfolio where the list of excluded corporates rose by only one, to 25 in total. This contrasts with the ‘extended’ portfolio where the number of exclusions rose 23% to 95 constituents of the S&P 500 Index. See Figure 6 and Figure 7.
Figure 6: Number of constituents of the S&P 500 excluded from the three portfolios as in December 2013
Source: S&P Dow Jones Indices, SICM
Figure 7: Number of companies excluded (2009-2013) in the three portfolios
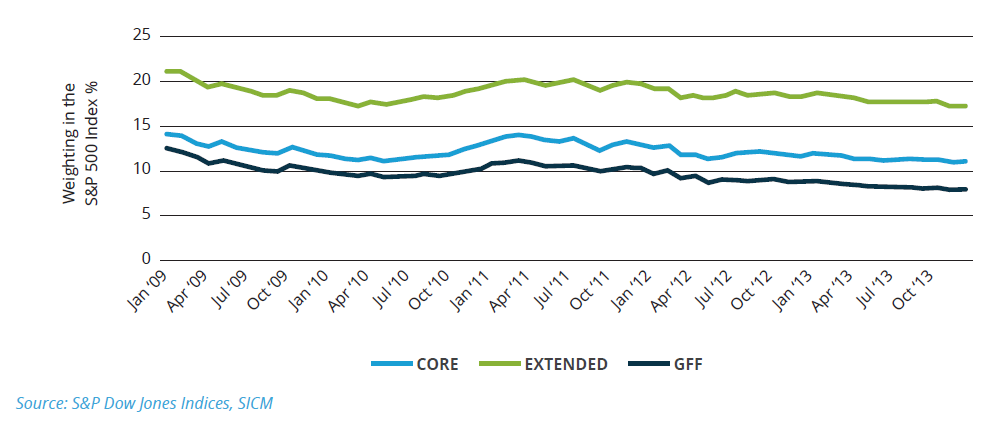
Despite the rise in the number of excluded securities from the three portfolios, on a weighting basis the opposite is true. Figure 8 shows the weighting in the S&P 500 Index of the excluded companies. As we have discussed above, it is the ‘extended’ portfolio that incurs the highest number of disqualifications, totalling 95 in December 2013, however the weighting of these securities in the S&P Index actually falls from above 20% in 2009 down to 17% by the end of 2013. Both the ‘core’ and ‘GFF’ portfolios exclusions show a similar declining trend in their weighting in the S&P 500 Index over this five year period.
Figure 8: Weighting in the S&P 500 Index of companies excluded (2009-2013) in the three portfolios
d/ Measuring the Asset Manager
If we assume that the Asset Owner clearly defined the fossil-fuel-free investment universe – in Section 3b, we identified a number of different interpretations – the Asset Owner will want to agree a benchmark by which to measure the success or failure of the Asset Manager’s investment skills. This should not be an afterthought, as it is the all-important measurement yardstick by which to judge the Asset Manager’s performance.
We might expect the defined investable universe to be matched by a comparable benchmark, but we find this is often not the case. Consider the following example.
If we take a particular theme to which an Asset Owner may wish to gain exposure, such as water, we may expect the Asset Manager to be measured against a water benchmark. However, an analysis of Morningstar data for the equity water sector in Europe shows that water company based benchmarks are not deemed a suitable yardstick by either the Asset Owner or perhaps the Asset Manager who has convinced the former to use an alternative. When measured by assets under management (AuM) we can see that MSCI World indices account for the vast majority of benchmarks used within this peer group, whether on a gross or net return basis, or one that is US or Euro denominated. Three percent of the water funds by AuM have no nominated benchmark. See Figure 9.
Figure 9: Morningstar Water Equity Sector (Europe) Benchmarks (by AuM).
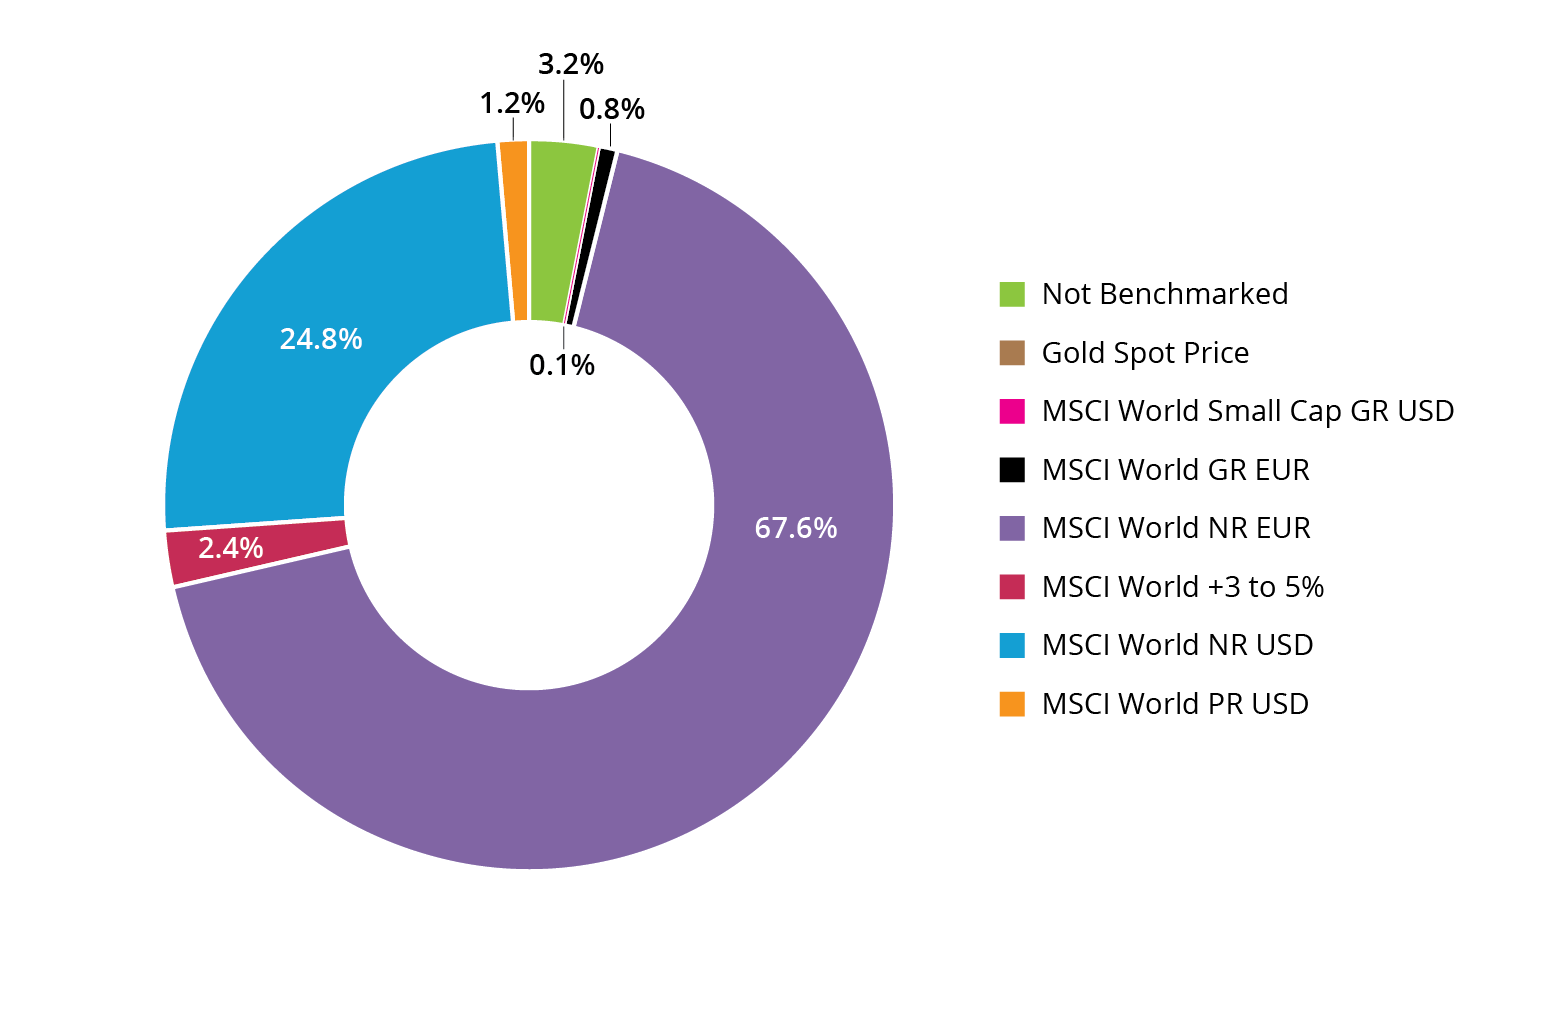
Source: Morningstar
Looking at another set of specialised funds – agriculture – few funds in this category are measured against an agriculture index. For agriculture funds, as defined by Morningstar, we note that just under half have no nominated benchmark. A further 30% of this peer group use MSCI World indices as their yardstick. Only about 15% of funds use either the S&P Global Agribusiness Equity or the DAX Global Agribusiness Indices. See Figure 10.
Figure 10: Morningstar Agriculture Equity Sector (Europe) Benchmarks (by AuM).
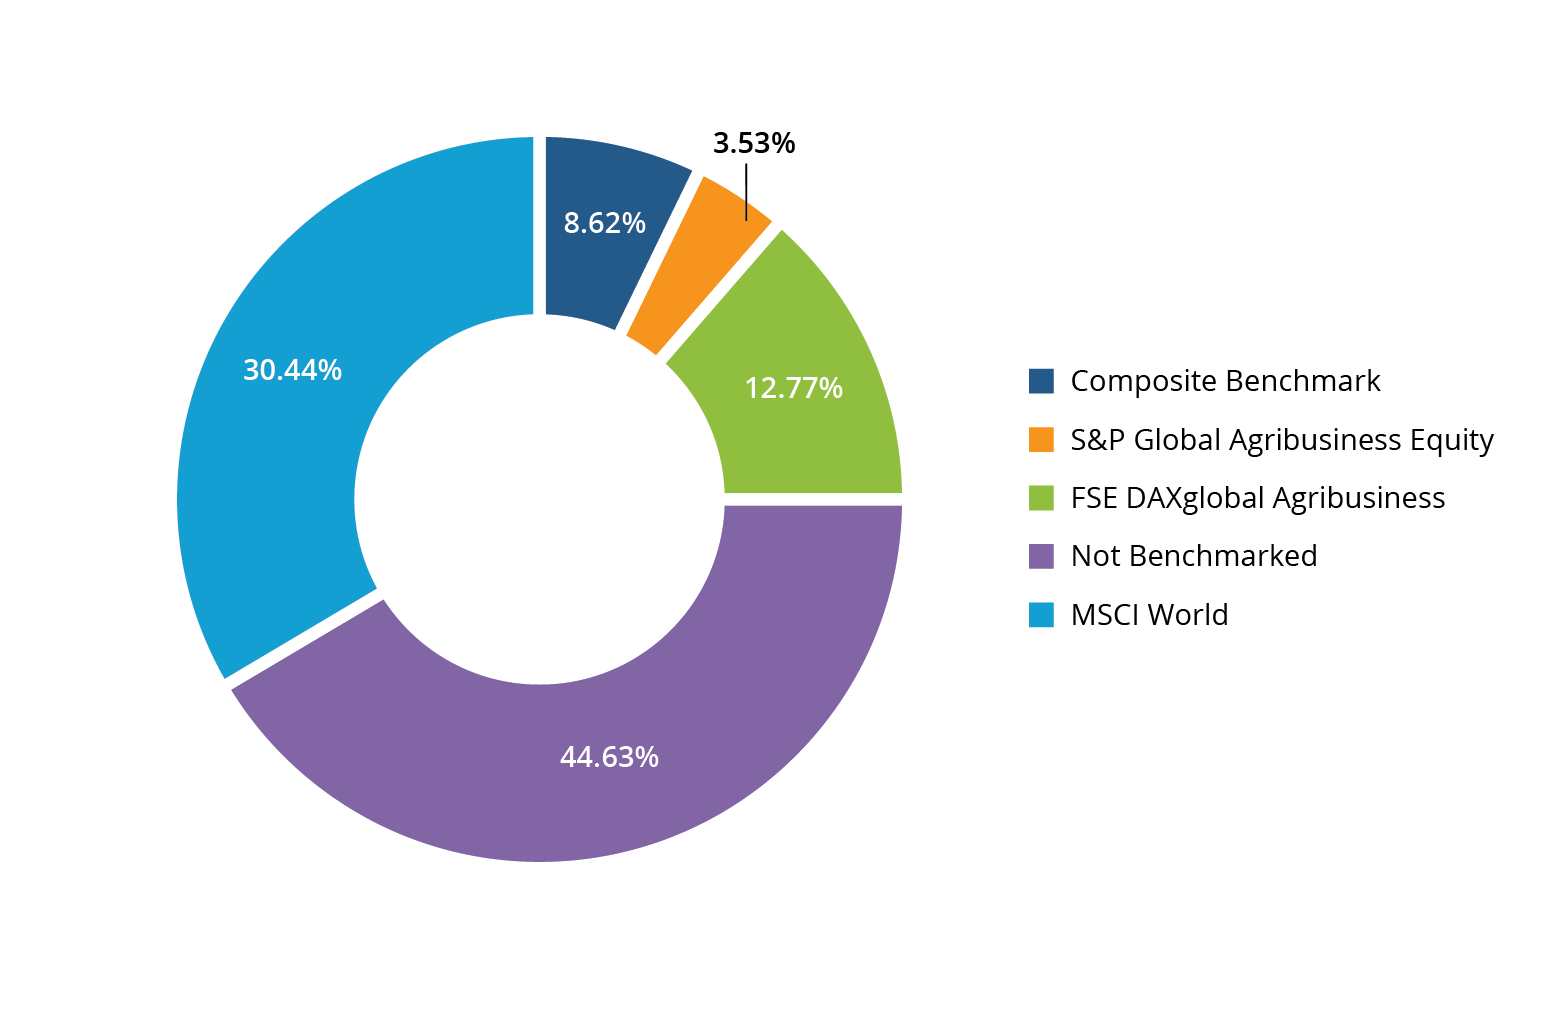
Source: Morningstar
Why is the case? We argue that Asset Owners have chosen to invest in water or agriculture funds as they believe that this theme will diversify their holdings and/or lead to significant shareholder returns, outperforming the equity market as a whole. Asset Owners may choose to measure the return of their water investment against the market index, such as MSCI World, in order to determine whether they have made a correct forecast. This does not appear to be unreasonable; however this benchmark will not help the Asset Owner determine whether the Asset Manager is skilled. If the water or agriculture themes do indeed deliver superior returns relative to general equity market returns, then the Asset Manager will show a performance track record that beats the MSCI World Index. However, this superior return cannot be solely attributable to the skill of the Asset Manager as under this scenario, all water and agribusiness funds would be expected to outperform world indices.
Figure 11: Morningstar Agriculture Equity Fund performance (Europe)
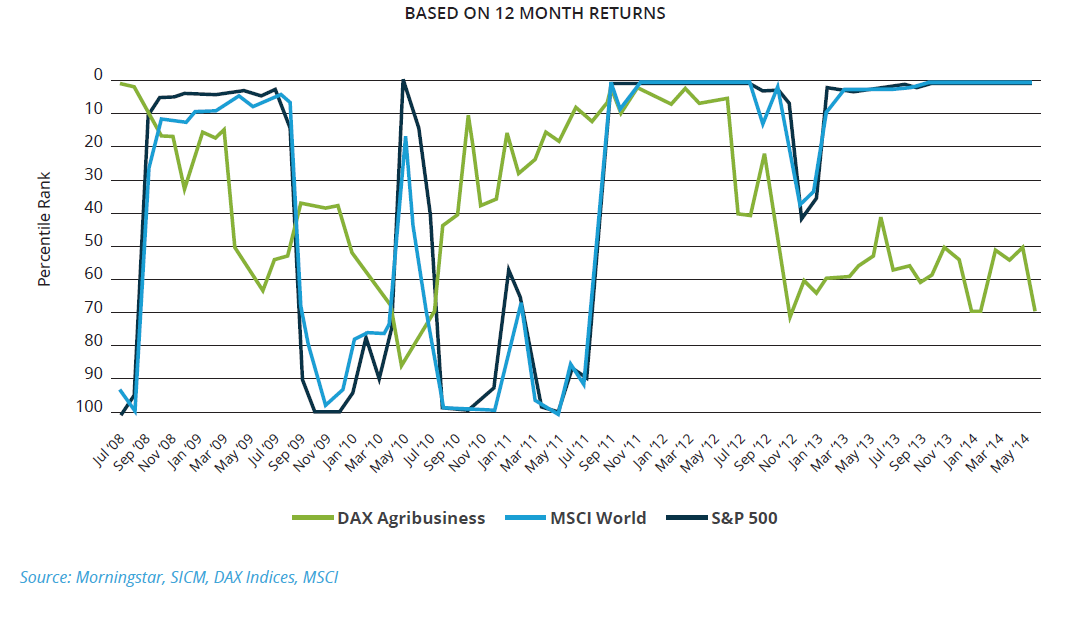
In Figure 11, we show three indices-DAXglobal Agribusiness, MSCI World and S&P 500-against the Morningstar agriculture peer group. On the ‘y’ axis we show the peer group percentile ranks for the Morningstar agriculture peer group, where zero is the best performer and one hundred the worst performer. It is evident that both the MSCI World and S&P 500 Indices can be seen to fluctuate between the worst and best percentile rankings of this Morningstar agriculture peer group, which comprises 129 funds. Since early 2013, if an Asset Manager had simply tracked the S&P 500 Index when running their agriculture fund, it would have resulted in the fund being a top performer against this European agriculture peer group. The same is true for the period from mid 2011 to mid 2012. It is noteworthy that even the more comparable DAXglobal Agribusiness Index fluctuates in the percentile rankings of this agriculture peer group although it spends less time at the percentile ranking extremes when compared to the MSCI World and S&P 500 Indices.
In the instance of a fossil-fuel-free fund, a range of possible benchmarks is available. If we apply the same thinking as the water fund Asset Owners, it would appear that many are likely to use a global benchmark (e.g. MSCI World or MSCI All Countries World Index) or perhaps one for a single geographical region, such as the USA, where the S&P 500 Index may be more appropriate. By choosing these benchmarks the Asset Owner is able to determine whether the fund can outperform the more traditional and high profile benchmarks. From the viewpoint of marketing companies, be they Victorious with an SEO focus or another with a wider market view, marketing point of view, this is a rational strategy. If, for example, an NGO which is promoting a fossil free approach wishes to provide evidence to support its mission, then choosing a well-known benchmark and outperforming it with an ex-fossil fuel fund provides an uncomplicated message to potential investors.
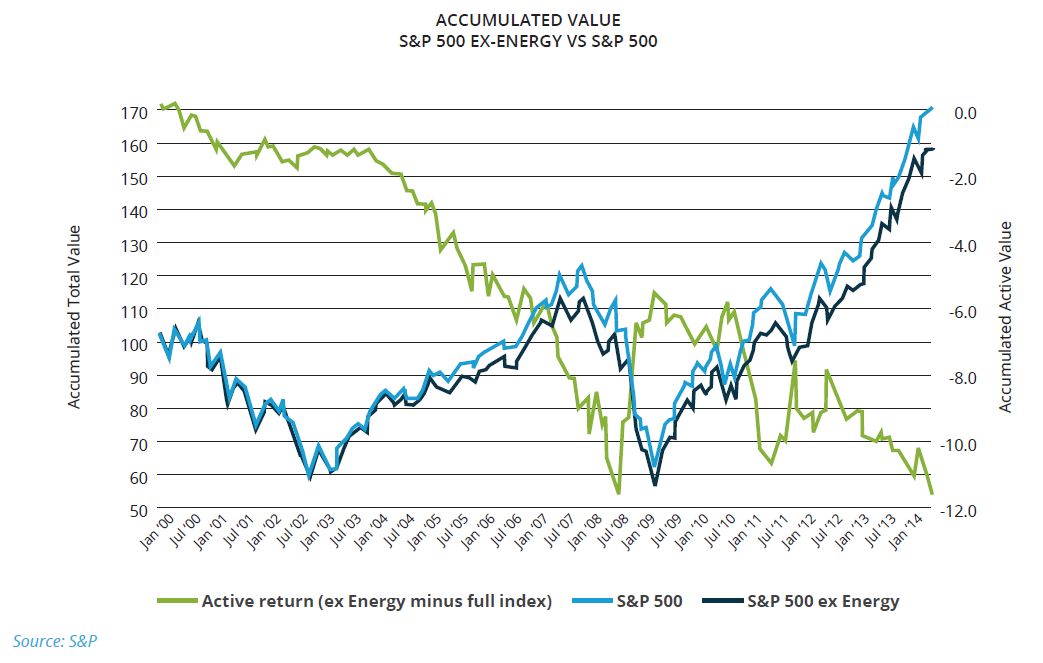
However, we are left with a problem – that it is difficult for the Asset Owner to measure the Asset Manager’s skill. We can demonstrate this in Figure 12. We have used a very simple premise that the Asset Owner does not wish to invest in US Energy companies. We have therefore measured the differential between the S&P 500 Index, which includes the Energy sector, and the S&P 500 Index ex-Energy. We show the differential between the ex-Energy and the full S&P 500 index as the active return line in Figure 12. There are periods, for example for much of the first half of 2011, when the ex-energy S&P outperforms the full S&P 500 Index. This outperformance has nothing to do with the skill of an Asset Manager as these are simply indices. The same is also true during periods of underperformance, for example from mid 2003 through to mid 2008 when Energy stocks were in favour, leading to the ex-Energy index underperforming the full S&P 500 Index.
Figure 12: The performance of the S&P 500 Index and the S&P 500 Index ex-energy
To be clear, we are not implying that Asset Managers are unable to add value by managing ex-Energy funds. We are saying that the Asset Managers, which are asked to exclude (say) Energy stocks, should be judged against an ex-Energy benchmark as this provides a meaningful way to evaluate the value of their investment skill within the set of variables they can control. We should also add that relative out- or under-performance of a benchmark is unlikely to be caused solely by the absence of particular Energy stocks, but importantly, also because of unintentional effects due to the omission of these securities. We discuss this effect in more detail in Section 5b.
4 Methodology
We analyse the returns of three different fossil-fuel-free portfolios: the ‘core’; ‘extended’ and ‘GFF’ portfolios. We make no judgement on whether one portfolio has superior fossil-fuel-free qualities to another; that is the Asset Owner’s decision. We only wish to examine the financial characteristics of each portfolio in terms of risks and returns.
In order to make financial comparisons between the portfolios easier, we have compared all three to the S&P 500 Index over the same time periods: one year, three years and five years, all ending on 31 December 2013. In order to capture the opening share prices at the beginning of January we take the closing prices for the last day of trading in December. For a market like Tokyo, where 31 December is a public holiday, we take the closing price on 30 December, when it is not a weekend.
In all three portfolios certain MSCI sub industries and their associated stocks have been excluded. All definitions of the portfolios and their exclusions may be found in Section 3c of this report. In all three portfolios, the initial investment that would have been made in these excluded sub industries is instead invested in the remaining S&P 500 constituents, on a market capitalisation pro-rata basis. Then the performance of this portfolio is compared to the full S&P 500 Index (without exclusions) to allow for a comparison of the fossil-fuel-free portfolio with the S&P 500 Index. The difference between the portfolio and its benchmark (the S&P 500 Index) is the active return.
We make no apology for adopting this relatively simple approach – using exclusions rather than a thematic approach or best-in-class approach – as the reader can more clearly observe the variables. The only subjectivity of our exclusionary approach is which sub industries to exclude, rather than whether a particular theme promotes a lower carbon environment or whether a particular company is really the best-in-class. We recognise that Asset Owners may have a myriad of exclusions they may wish to define as fossil-fuel related, but we hope the three portfolios we have chosen provide an indication of the risks and returns an Asset Owner would have incurred.
5 The results
a/ Fossil-fuel-free returns
In this section, we discuss the returns that investors would have made by adopting various fossil-fuel-free approaches. As discussed in Section 3b, there are various definitions for fossil-fuel-free investing. In Section 3c, we provided some examples of fossil-fuel-free portfolios, the ‘core’ portfolio, which we categorise as a bare minimum for fossil-fuel-free investing, and the more comprehensive ‘extended’ portfolio, which aims to capture more of the carbon cycle. Also discussed was the ‘Go Fossil Free’ (GFF) portfolio, which excluded a list of the largest oil and coal companies, ranked by carbon reserves, as compiled by the Carbon Tracker Initiative.
In an attempt to make a clean comparison between these three portfolios and the S&P 500 Index, we simply exclude each of the sub-industries as described in Section 3c and invest this sum on a pro-rata basis in the remaining S&P 500 Index constituents. So for the sake of clarity, the ‘core’ portfolio excludes eight sub-industries, including Oil & Gas Drilling, Coal & Consumable Fuels as well as Integrated Oil & Gas. The initial investment that would have been made in these now excluded sub-industries, is instead invested in the remaining S&P 500 Index constituents on a market capitalisation pro-rata basis. The performance of this ‘core’ portfolio is then compared to the full S&P 500 Index (with no exclusions) to see which portfolio achieves the best performance over set time periods. The difference between the two returns is called the active return.
‘Core’ portfolio performance
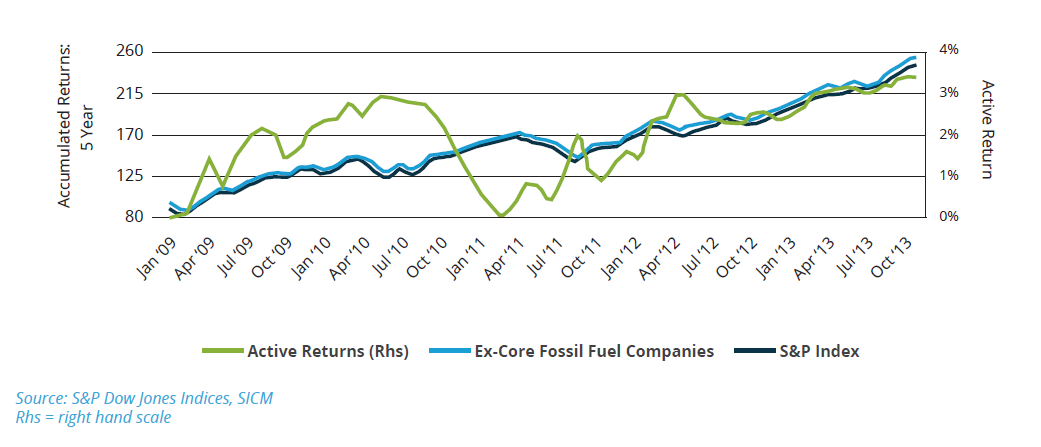
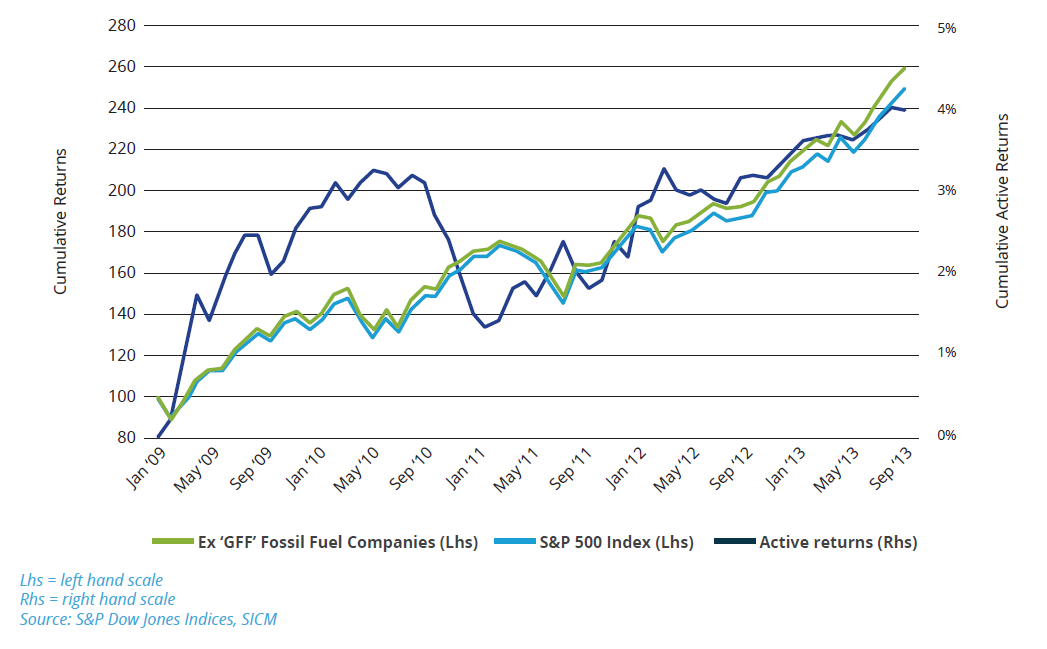
Figures 13 to 15 show the cumulative total returns of the S&P 500 Index and the S&P 500 Index ex the ‘core’ holdings. Both indices are re-based to 100 at the beginning of the relevant time period, as shown on the left-hand scale. The active return, shown on the right hand scale, is the performance of the ‘core’ portfolio minus the performance of the S&P 500 Index. A positive active return indicates that the former was a better performer than the latter. A positive active return of 3% would indicate that the ‘core’ portfolio outperformed the S&P 500 by three percentage points over the measured time period. We show performance over one year (2013), three years (2011 to 2013) and five years (2009 to 2013), all ending 31 December 2013. In order to capture the opening share prices at the beginning of January we take the closing prices for the last day of trading in December. Over all three time periods the ‘core’ portfolio produced a higher total return (which includes both capital gain and income) than the full index. Certainly over the shortest time period the difference is very small, but over three and five years the outperformance of the ‘core’ portfolio became meaningful.
Figure 13: Cumulative returns of ‘core’ portfolio against S&P 500 Index over one year (2013)
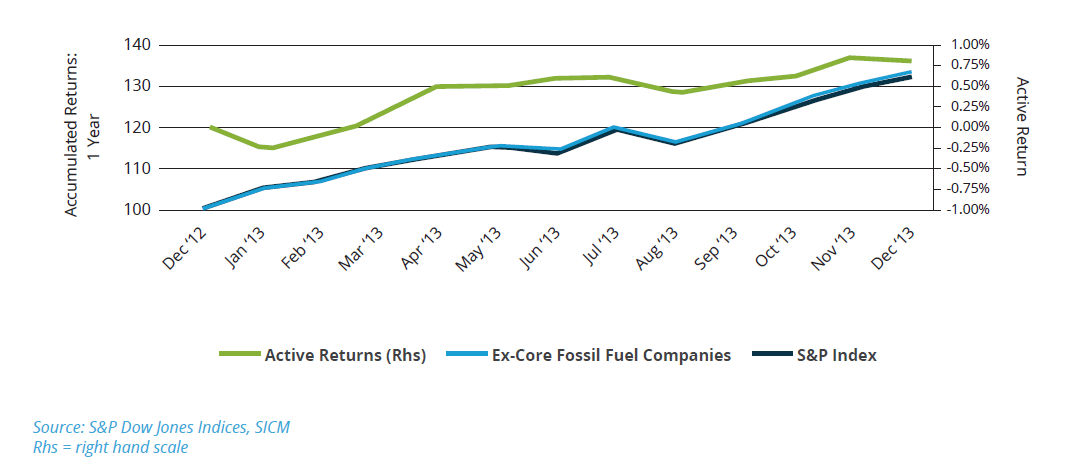
Figure 14: Cumulative returns of ‘core’ portfolio against S&P 500 Index over 3 years (2011-2013)
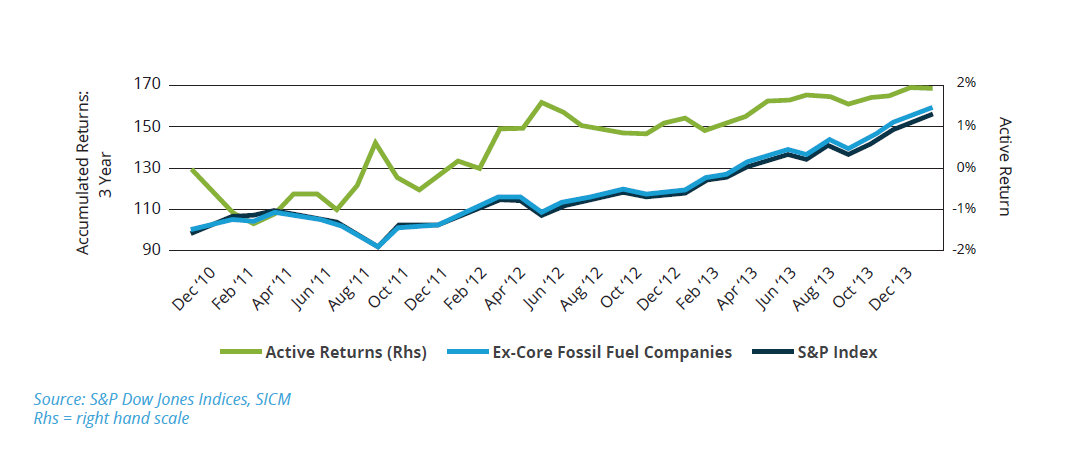
Figure 15: Cumulative returns of ‘core’ portfolio against S&P 500 Index over 5 years (2009-2013)
Also of interest to the investor is how volatility is affected by making such an investment. This we show in Figures 16 and 17. We estimated rolling one-year and three-year volatility and note that in general, volatility declines for both the ‘core’ portfolio and the S&P 500 Index. The level of volatility for each moves in tandem. This is not too surprising given the overall bet size represents around 10% of the portfolio on average and as we are simply pro-rating the residual weight back into the other sectors the final portfolio is still relatively close to the benchmark. Although the Energy sector might be considered to be one of the more volatile sectors, and therefore we might reasonably expect a decline in the volatility of the ex-Energy portfolios, the additional weight is allocated to other sectors like Financials and Information Technology, which are themselves reasonably volatile. Therefore, the final portfolio appears to exhibit the same overall level of volatility as the broad market index. Perhaps more interesting to note is the general decline in volatility after the Global Financial Crisis: Over the longer estimation window, i.e., 3 years, we observed a 33% decline in the volatility levels of both the portfolio and the benchmark.
Figure 16: Rolling volatility of the ‘core’ portfolio over 12 months
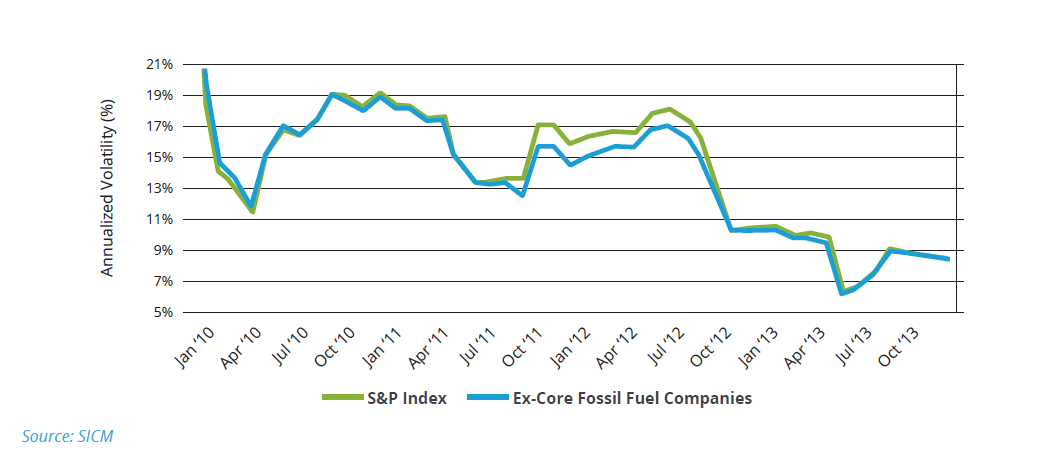
Figure 17: Rolling volatility of the ‘core’ portfolio over 3 years
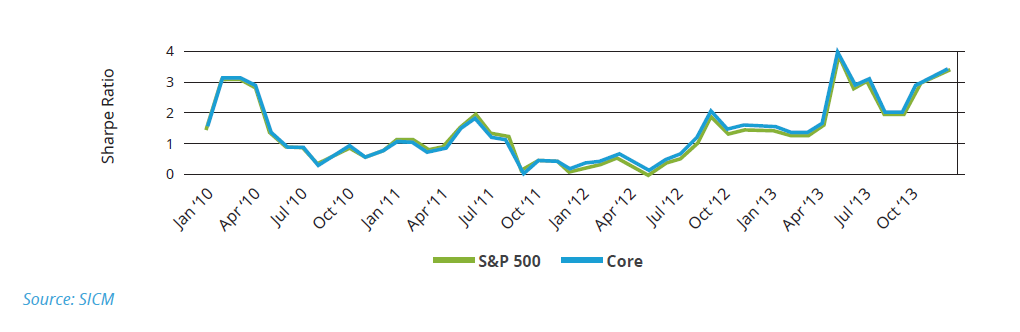
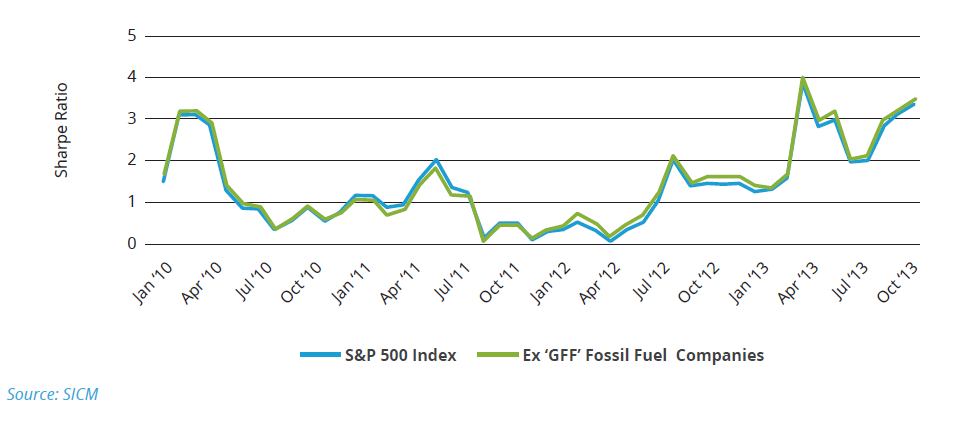
With higher returns and a commensurate level of volatility it is no surprise that the Sharpe ratio – a risk-adjusted measure of return – of the ‘core’ portfolio is higher than that of the S&P 500 index. This indicates that excess return above the benchmark is not being generated via additional volatility. See Figure 18.
Figure 18: The 12-month rolling Sharpe Ratio for the ‘core’ portfolio and S&P 500 Index
‘Extended’ portfolio performance
Figures 19 to 21 show the cumulative returns of the S&P 500 Index and as well as that of the S&P 500 Index ex the ‘extended’ holdings. Both indices are re-based to 100 at the beginning of the relevant time period, as shown on the left-hand scale. The active return, shown on the right hand scale, is the difference between the performance of the ‘extended’ portfolio and the S&P 500 Index. Performance is shown over one year (2013), three years (2011 to 2013) and five years (2009 to 2013), with all periods ending 31 December 2013.
Figure 19: Cumulative returns of ‘extended’ portfolio against S&P 500 Index over one year (2013)
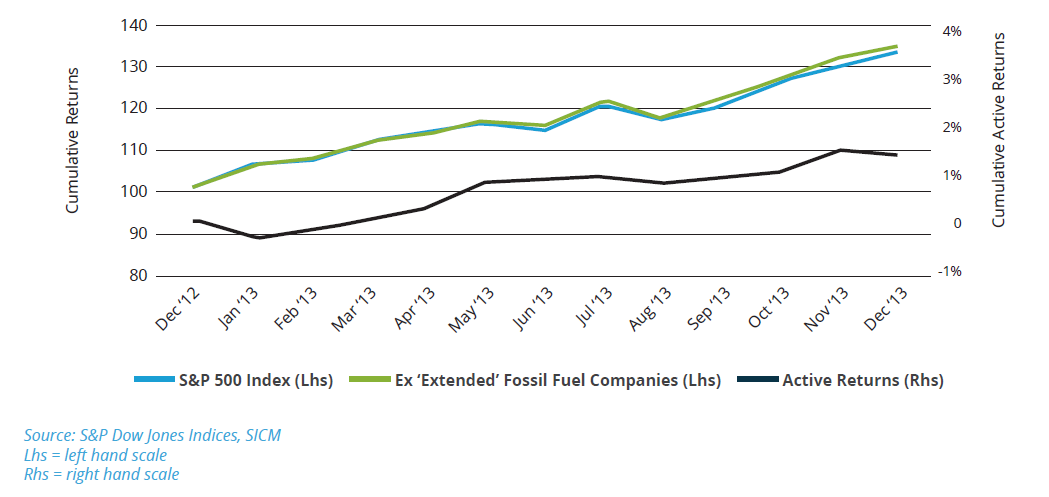
Figure 20: Cumulative returns of ‘extended’ portfolio against S&P 500 Index over 3 years (2011-2013)
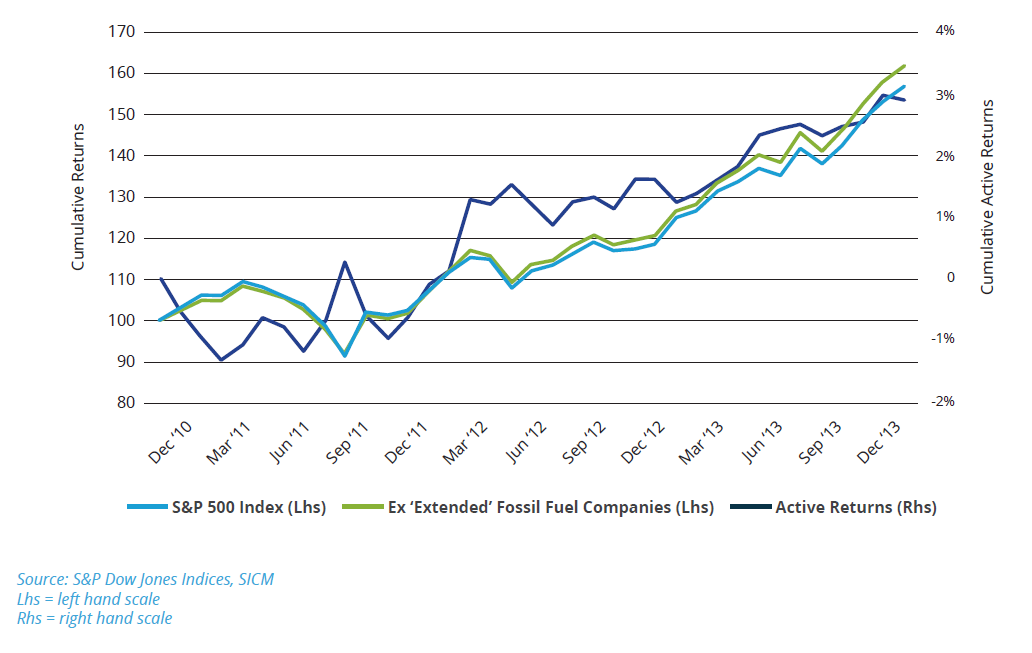
Figure 21: Cumulative returns of ‘extended’ portfolio against S&P 500 Index over 5 years (2009-2013)
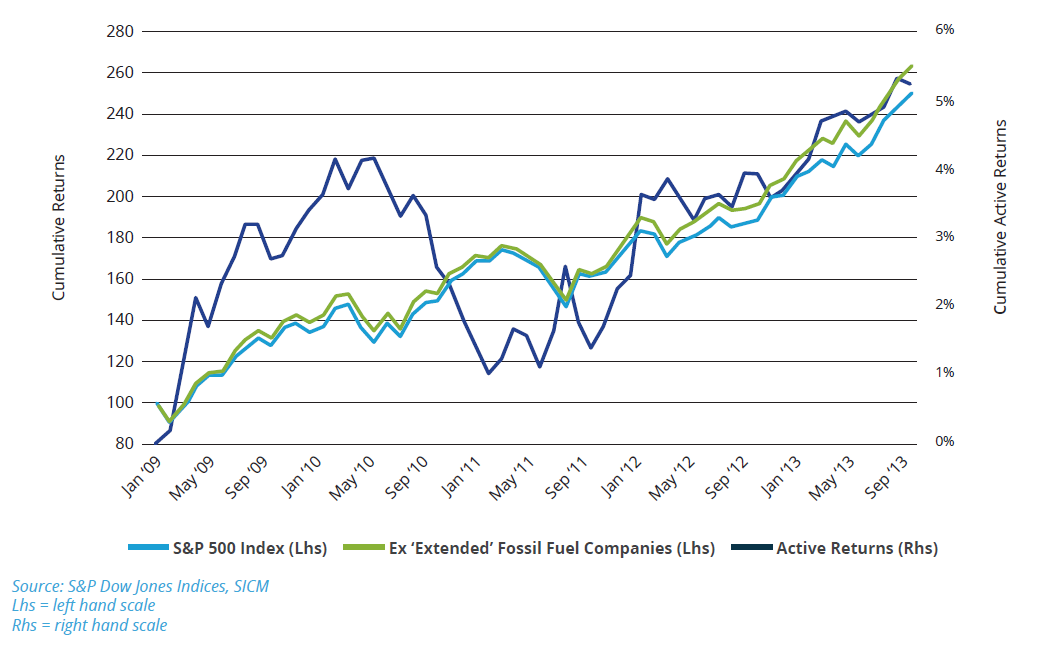
As with the ‘core’ portfolio, over all three time periods the ‘extended’ portfolio produced a higher total return (both capital gain and income) than the full index. Over the full five-year period, the outperformance of the ‘extended’ portfolio exceeded 5%. This is superior to the performance observed for the ‘core’ portfolio over the same time period.
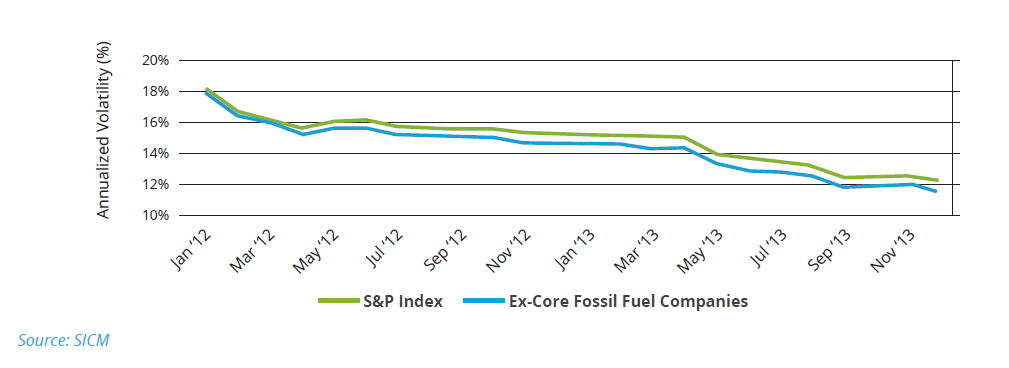
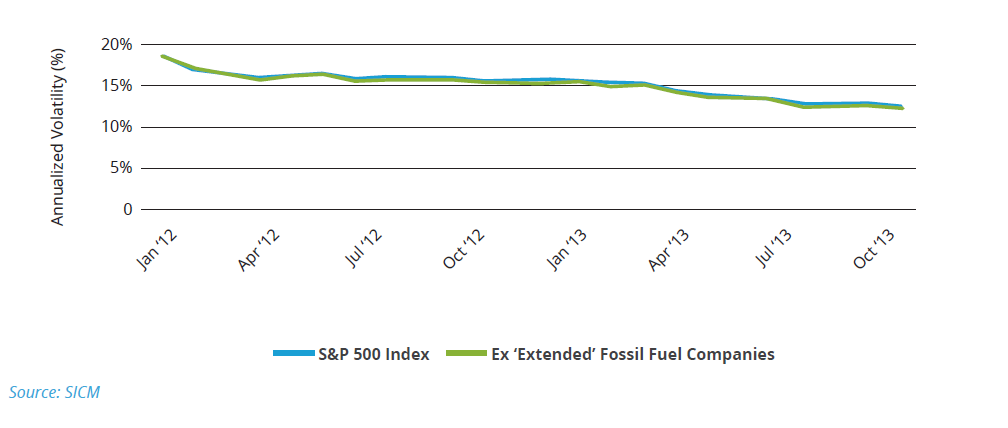
As with the ‘core’ portfolio we are able to observe that the improved performance was not simply the result of increased volatility; the opposite is true. See Figures 22 and 23. Both the S&P Index and the ‘extended’ portfolio demonstrate declining volatility on rolling 12- and 36-month bases. As mentioned in the previous section, we look at how volatility is affected by making such an investment. Rolling one-year and three-year volatility is estimated and as previously noted, volatility declines for both the S&P 500 Index and in this case, the ‘extended’ portfolio. The level of volatility once again moves in tandem.
Figure 22: Rolling volatility of the ‘extended’ portfolio over 12 months
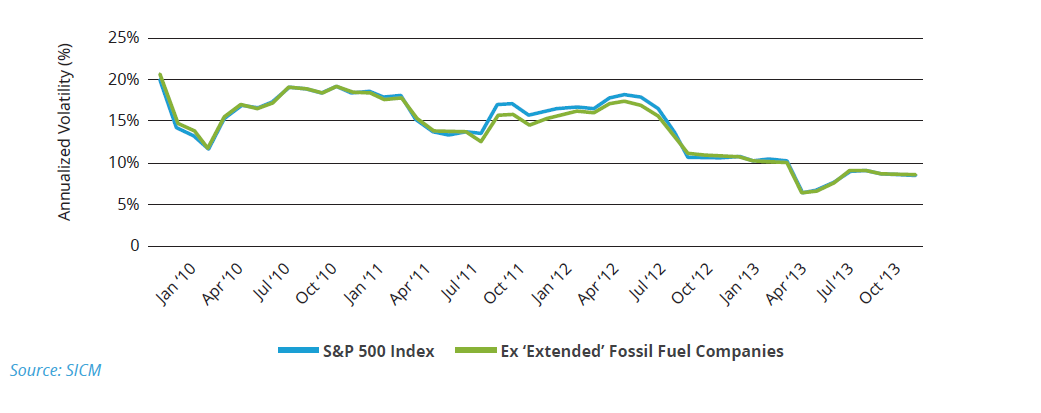
Figure 23: Rolling volatility of the ‘extended’ portfolio over 3 years
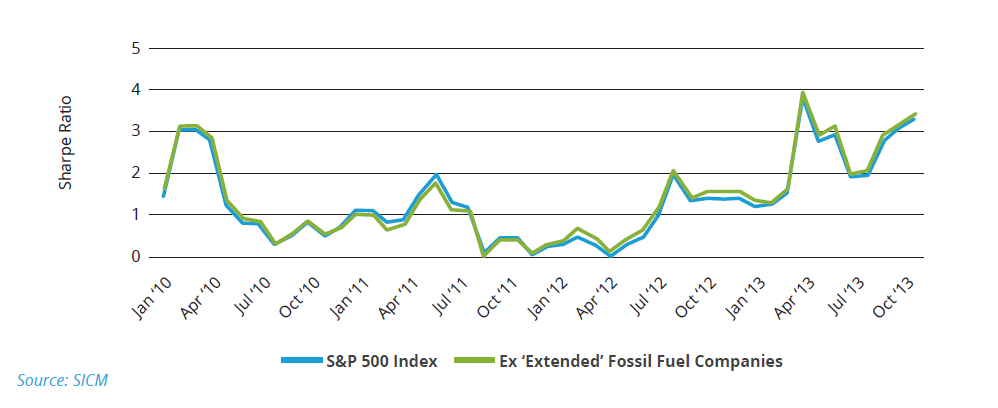
With a positive active return over the S&P 500 Index and falling volatility, we observe a rising Sharpe Ratio between 2010 and 2013, although this is not a steady improvement, as marked volatility between mid-2010 and mid-2012 can be seen. See Figure 24.
Figure 24: The 12 month rolling Sharpe Ratio for the ‘extended’ portfolio and S&P 500 Index
‘GFF’ portfolio performance
Figures 25 to 27 show the cumulative total returns of the S&P 500 Index and the ‘GFF’ portfolio. Both indices are re-based to 100 at the beginning of the relevant time period, as shown on the left-hand scale. The active return, shown on the right hand scale, is the performance of the ‘GFF’ portfolio relative to the complete S&P 500 Index. We show performance over one year (2013), three years (2011 to 2013) and five years (2009 to 2013), all periods ending 31 December 2013.
Figure 25: Cumulative returns of ‘GFF’ portfolio against S&P 500 Index over one year (2013)
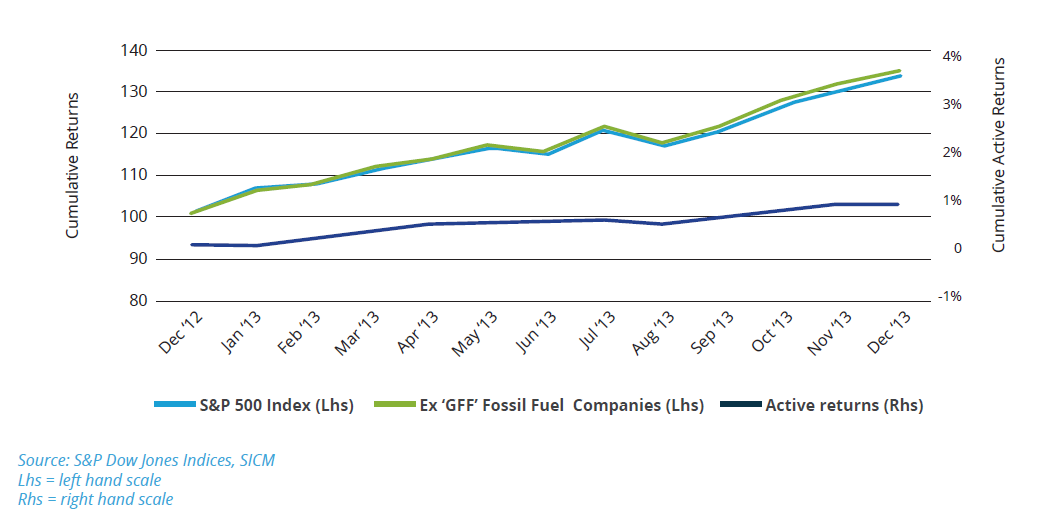
Figure 26: Cumulative returns of ‘GFF’ portfolio against S&P 500 Index over 3 years (2011-2013)
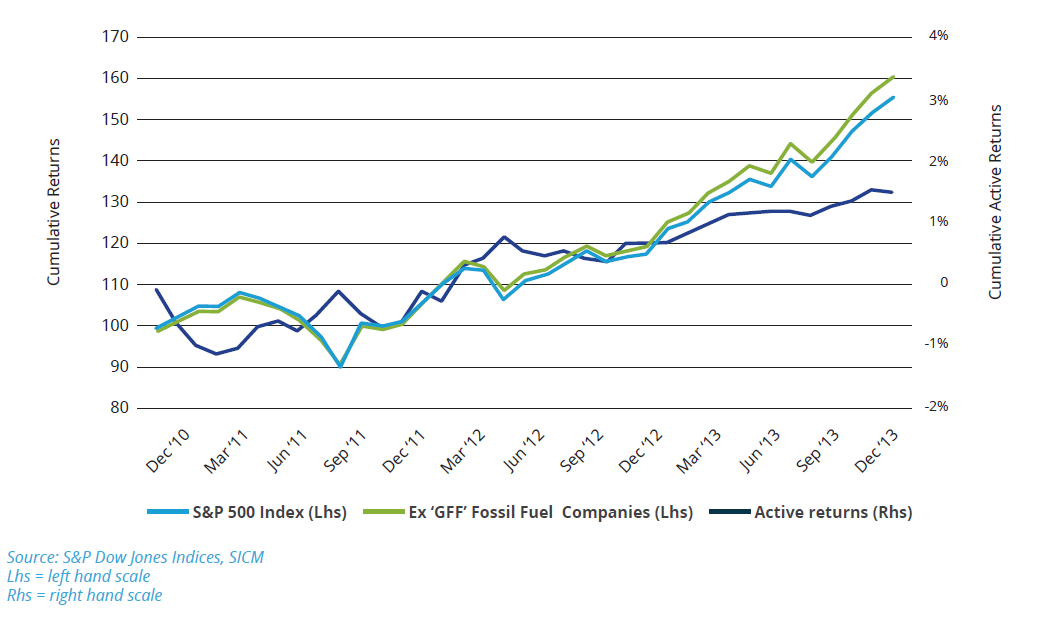
Figure 27: Cumulative returns of ‘GFF’ portfolio against S&P 500 Index over 5 years (2009-2013)
We see that the ‘GFF’ portfolio provides an accumulated active return, over five years, which is superior to the ‘core’ portfolio, but inferior to the ‘extended’ portfolio. Over the three-year period of 2011 to 2013, the GFF portfolio provides the lowest cumulative active return of all the strategies.
What is entirely consistent with the other two portfolios is the declining rolling volatility over both a 12 month and 36 months periods, ending December 2013. See Figures 28 and 29. The level of volatility for each moves in tandem. Once again, this is not too surprising given the relatively few exclusions imposed by the GFF constituents within the S&P 500.
Figure 28: Rolling volatility of the ‘GFF’ portfolio over 12 months
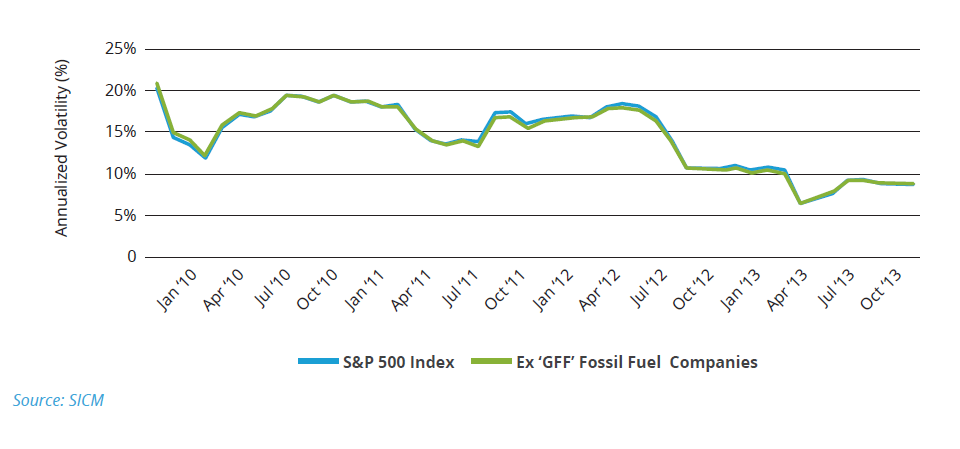
Figure 29: Rolling volatility of the ‘GFF’ portfolio over 3 years
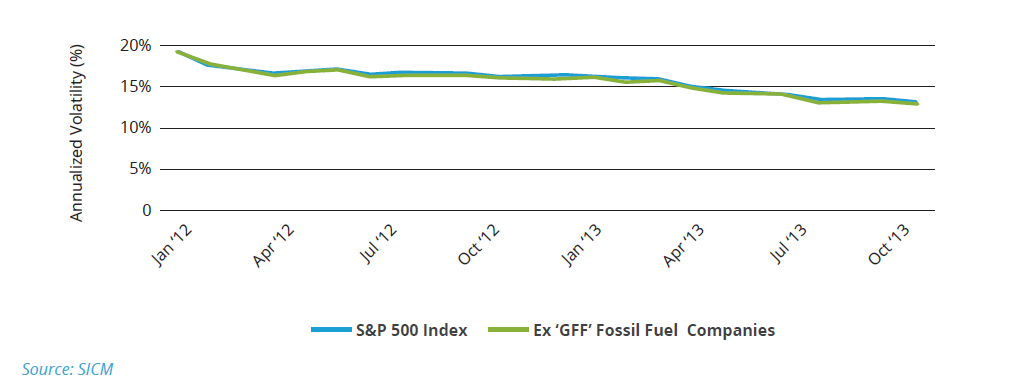
Figure 30: The 12-month rolling Sharpe Ratio for the ‘GFF’ portfolio and S&P 500 Index
Again, consistent with the other ex-fossil fuel portfolios, we note the rising trend in the Sharpe ratio. See Figure 30. Again, we observe the fall in the Sharpe ratio from mid 2011 to mid 2012 when it reached zero, but subsequently peaked at just above 4.0 in mid-2013.
Summing up performance
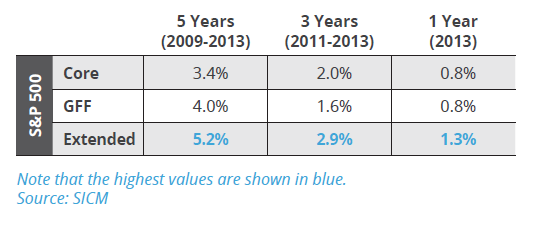
All three ex-fossil fuel portfolios outperformed the S&P 500 over five-year, three-year and one-year periods. See Table 4. Over the longest time period the ‘extended’ portfolio provided a significant cumulative active return of 5.2%, the ‘GFF’ portfolio provided 4.0%, and the ‘core’ portfolio 3.4%.
Table 4: Cumulative active returns compared to the S&P 500 Index
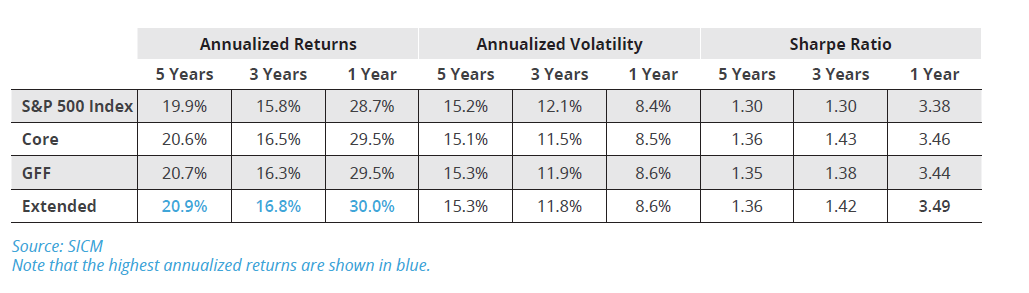
In terms of volatility, all three portfolios showed similar levels of annualized volatility to each other and to the S&P 500 Index. Driven by the superior performance all three portfolios and declining volatility levels we observed superior and increasing Sharpe ratios when compared to the Index. See Table 5.
Table 5: Annualized returns & volatility and Sharpe ratios for the portfolios and the S&P 500 Index
b/ Beware the unintended consequences
In previous sections of this report we have assumed that the Asset Owner has made a conscious decision to remove certain sub-industries from the investment universe, with the purpose of reducing their exposure to fossil fuels. Now we will examine the effect of this decision, and other collateral decisions, whether intentional or not.
To determine the impact of imposing portfolio constraints (i.e. the exclusion of certain securities) we use a MSCI Barra portfolio management analytics model to help us understand the portfolios’ exposures and return attributions effects to various factors. This framework allows us to understand the impact on the portfolios to factors such as countries, industries (sectors), currencies, and risk indices (e.g. investment styles such as Size, Momentum and Volatility). Please see definitions of risk indices in Section 8.
Following on from the Asset Owner’s decision to eliminate their exposure to fossil fuel companies, it is the function and responsibility of the Asset Manager to try to maximise the return of the portfolio whilst adhering to these pre-determined constraints. To undertake this role successfully, the Asset Manager needs to understand both the intentional and unintentional risks associated with running such a portfolio.
The key risks in the ‘core’ portfolio
By running a historical analysis of a simple portfolio structure that excludes those sub-industries associated with the definition of the ‘core’ portfolio (see Section 3c for details) and reallocating the divested portion on a pro-rata basis across the remaining S&P 500 constituents, we scrutinize the five-year results using MSCI Barra analytics in order to determine the how various risk (and return) factors contribute to the cumulative active return.
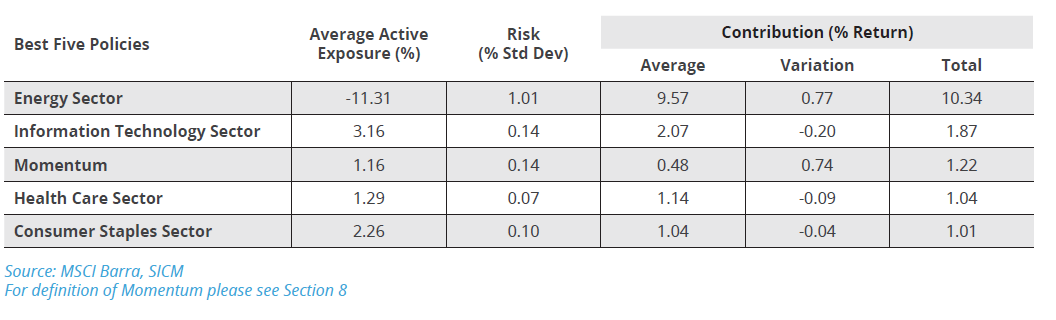
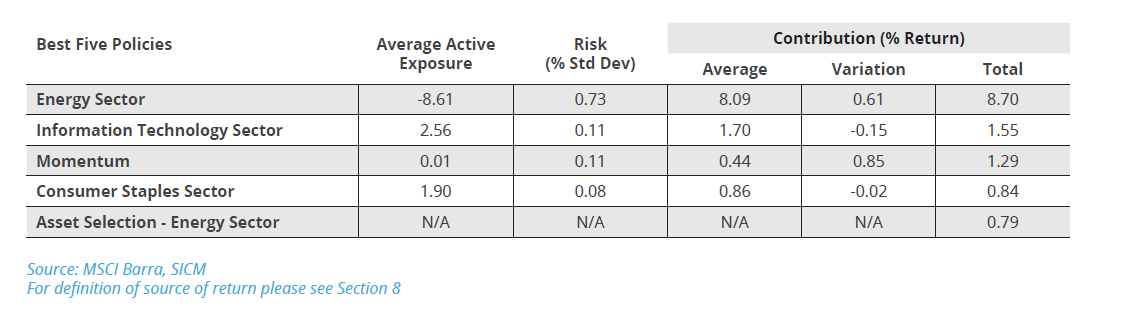
In Table 6 we show the five highest contributors to the active return of the ‘core’ portfolio over the last five years. It is probably of little surprise that the omission of Energy stocks was the major contributor, accounting for nearly 10 percentage points of the cumulative active return. What is less obvious is that by pro-rating the Energy sector’s allocation to the rest of the S&P 500’s sectors, the portfolio benefitted from an overweighting in Information Technology, Health Care and Consumer Staples sectors as well. These ‘benefits’ may have been unexpected, but they had a positive impact on performance. In addition, by excluding the Energy sector, the ‘core’ portfolio benefitted from a positive exposure to Momentum, aided by a rising equity market environment. Again, this exposure, and hence risk, would not initially have been expected by the Asset Owner nor the Asset Manager.
Table 6: Five largest positive contributors to cumulative active return in the ‘core’ portfolio
If we leave aside the contribution from the sector weightings, we can examine what happened to other risk sources – like Momentum – and examine their contribution to the ‘core’ portfolio’s active return. See Table 7. We can see that the Momentum factor makes the largest positive contribution to active return and other factors like Growth and Size also make meaningful contributions. Not all risk indices made a positive contribution. As we discuss below, Beta makes a notable negative impact, as does Earnings Yield.
Table 7: ‘Core’ portfolio attribution report from risk indices (annualized contributions)
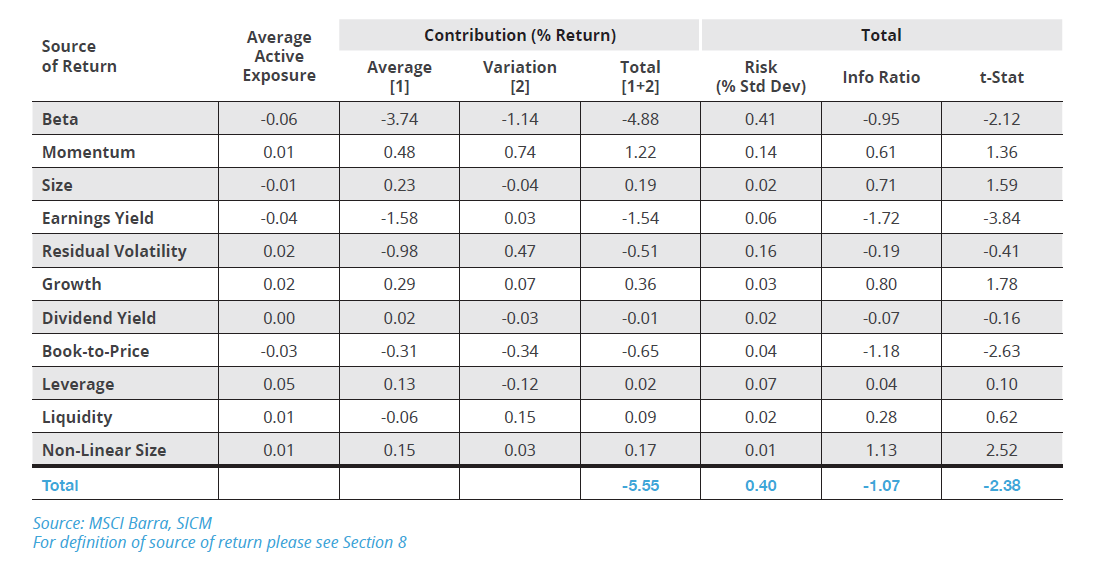
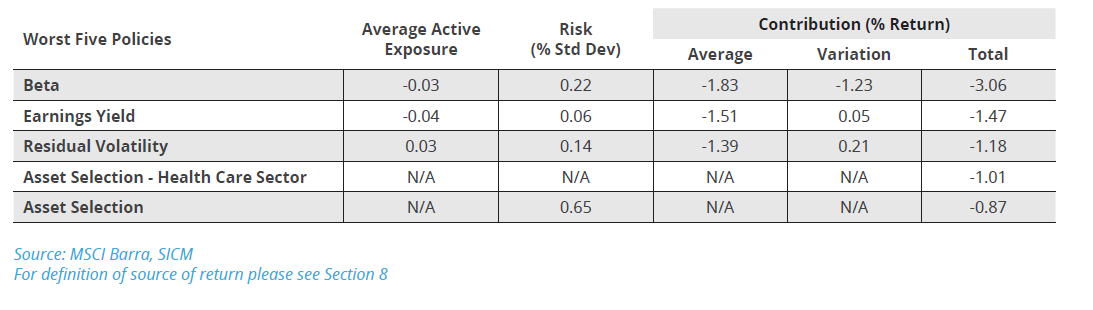
Table 8 shows the major effects that reduced the return of the ‘core’ portfolio. The greatest negative impact was from the Beta of the ‘core’ portfolio, the exposure of which was lowered by the elimination of the Energy sector. The cost to the portfolio’s cumulative active return was nearly 5 percentage points, cancelling out nearly half of the upside provided by the Energy sector underweighting discussed above. Generally, asset (stock) selection was poor across the portfolio and within the Health Care sector. Note that although the overweighting of the health care sector itself was positive, the investments made in the individual health care stocks were poor. We are careful to note here that stock selection in this case is nothing more that the result of the pro-rating of the additional capital resulting from the exclusion of the Energy sector. There is no “skill” here to measure. As this portfolio is a US-based fund, with no overseas exposure, the asset selection and asset selection for the Americas region shows the same contribution to return.
Table 8: Five largest negative contributors to cumulative active return in the ‘core’ portfolio
The key risks within the ‘extended’ portfolio
The ‘extended’ portfolio excluded many more sub-industries and securities than the ‘core’ portfolio; the core’s exclusions being a subset of the ‘extended’ portfolio’s. The ‘extended’ portfolio was the best performing of the three, over a five-year period. (See Section 5a.)
With this portfolio we can again see that the greatest cumulative contribution to the active return of the fund, when measured against the S&P 500 Index, was the underweighting of the Energy sector. See Table 9.
Table 9: Five largest positive contributors to cumulative active return in the ‘extended’ portfolio
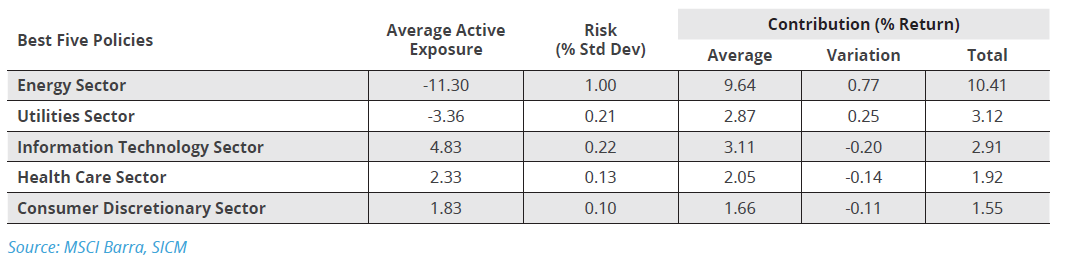
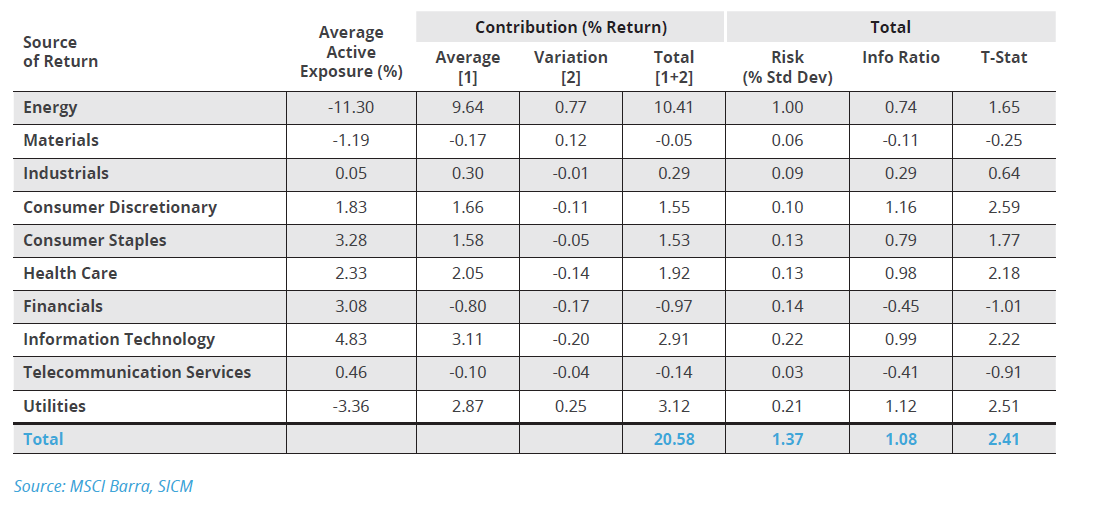
We are able to view the effect of the sector realignment – pro-rating the excluded sub-industry weightings to the remaining S&P 500 sectors – in further detail. See Table 10. Although the Energy sector underweighting made a significant positive contribution of 10.4% other sectors such as Information Technology, Utilities, Health Care, Consumer Discretionary, and Consumer Staples also made meaningful contributions. The Telecommunication Services and Financials sectors made a negative contribution to active returns.
Table 10: ‘Extended’ portfolio attribution report by industry (cumulative contribution)
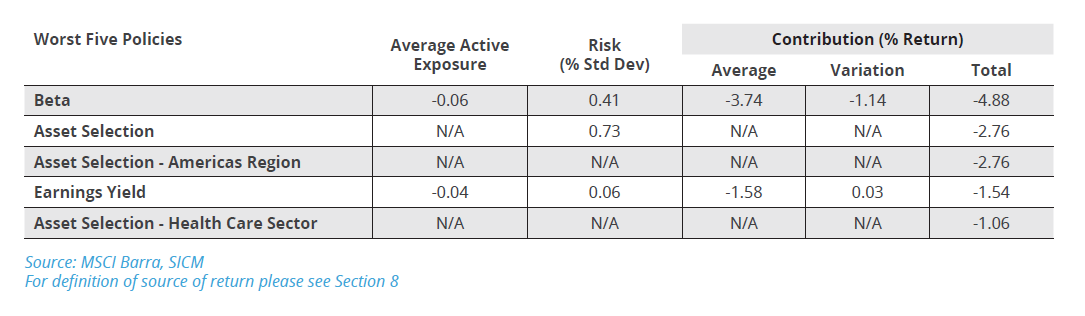
Detracting from performance was again Beta. As with the ‘core’ portfolio this made the largest negative contribution, over 4 percentage points, to the active return of the portfolio. See Table 11. Asset Selection was also a detractor as was Earnings Yield – the difference based on a company’s earnings relative to its price – and Residual Volatility – returns from high volatility not explained by the Beta factor. Unless the Asset Manager analyses these returns we believe that it would be hard to predict these influences. Once understood the Asset Manager is able to then manage the portfolio for these effects.
Table 11: Five largest negative contributors to cumulative active return in the ‘extended’ portfolio
The key risks of the ‘GFF’ portfolio
The ‘GFF’ portfolio, which was the least constrained by the exclusions, has a similar set of positive contributors to active return as the ‘core’ portfolio. The underweighting of the Energy sector is again the largest contributor to active return at nearly 9 percentage points. See Table 12. Also the increased exposure to the Information Technology sector, Momentum and Consumer Staples also reappear.
Table 12: Five largest positive contributors to cumulative active return in the ‘GFF’ portfolio
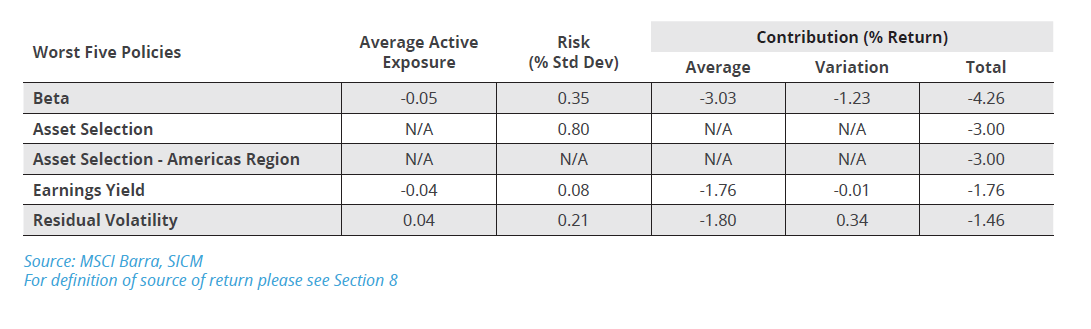
On the negative side, as with the other two portfolios (‘core’ and ‘extended’) Beta tops the list. See Table 13. The lower beta of the ‘GFF’ portfolio caused the portfolio to give-up returns in an on-average rising market, hampering returns by 3 percentage points. Residual volatility and Earnings Yield also acted as a drag on active returns. This is similar to the ‘extended’ portfolio’s negative contributors to return.
Table 13: Five largest negative contributors to cumulative active return in the ‘GFF’ portfolio
c/ Summing up the effect of both intentional and unintentional exposures to risk
Many professional investors may well have been able to forecast that the single largest, positive contributor to returns would be the large underweighting of the Energy sector. In all three portfolios this was the most important, positive contributor to active returns, when measured against the S&P 500 Index. Perhaps more difficult to predict was the positive contribution made by the overweighting of the Information Technology sector in all three fossil-fuel-free portfolios. Likewise, the importance of the Health Care sector in two of these portfolios would not instantly spring to mind.
On the negative side of active return contribution, was the decline in the beta, relative to the S&P 500 Index. This was the single most important negative contributor. An Asset Manager running fossil-fuel-free portfolios should bear this in mind when constructing the portfolios, and manage this unintentional risk, particularly if the market goes on a sustained upward trend. It is also noteworthy that Earnings Yield – the return difference based on a company’s earnings relative to its price – was a major negative contributor in all three portfolios. Again, a robust portfolio construction process would adjust for this and manage this unintended risk.
The Asset Owner chose to reduce fossil fuel exposure, however, assuming no control of other risk factors, ended up overweighting Information Technology and Health Care (and being rewarded with higher returns) whilst reducing Beta and Earnings Yield exposure, which turned out to be detrimental to active returns.
6 Conclusion
Whether to adopt a fossil fuel divestment strategy is highly topical. Initial nonchalance by the financial community has given way to more rigorous scrutiny. It is possible to push the moral argument to one side and solely examine the financial implications of such an investment strategy.
Initially Asset Owners need to be clear with their definition of what a fossil-fuel-free portfolio should include and exclude. There are a range of options available. These portfolios can exclude different parts of the carbon cycle – ranging from eliminating only the owners and developers of fossil fuel reserves, to rejecting the many consumers of fossil fuels as well (e.g. airlines and auto makers). In addition, there are a variety of investment processes that attempt to capture fossil-fuel-free returns. At the simpler end, but providing clarity, is the negative screen. More complex can be a portfolio tilting approach to those companies with ‘better’ carbon strategies. Most subjective is the thematic investing approach.
It appears the financial market is not entirely agreed on how best to measure the performance of an Asset Manager of these more specialised funds. An investigation of themed funds such as water and agribusiness implies that many Asset Owners are comfortable judging the performance of their funds relative to global benchmarks.
We examined three different ex-fossil fuel portfolios, adopting different negative screens, and compared all three to the same benchmark (S&P 500 Index). By using only one country we minimised geographical influences. We found that the excluded part of the S&P 500 Index varied considerably over time from 11% to 19%. In turn this had implications for the risks and returns of these portfolios.
All three ex-fossil fuel portfolios outperformed the S&P 500 Index’s over the one year, three year and five year periods ending December 31, 2013. The best performing ex-fossil fuel portfolio produced a cumulative active return of 5.2% over a five-year period. Helped by superior performance and volatility levels commensurate with the S&P 500, all three portfolios demonstrated a superior Sharpe ratio to the S&P 500 Index over the five-year period (ended 31 December 2013).
An analysis of the cumulative active returns of the three ex-fossil fuel funds revealed some unexpected sources. Although the absence of the Energy sector was a predicted source of positive returns, the importance of an overweighting of the Information Technology and Health Care sectors was less so. There were also negative contributors to the funds’ returns, notably the lower Beta of these portfolios relative to the S&P 500 Index and also the underweighting of the Earnings Yield factor. Beta alone reduced active performance in the portfolios by between 3.1 and 4.9%.
Fossil-fuel-free investing did deliver superior returns relative to the S&P 500 Index during several recent time periods. Interestingly, the most constrained portfolio, which had the highest level of exclusions, performed the best. We showed that the returns of these portfolios could have been further improved if the Asset Manager had controlled the unintended risks associated with implementing an ex-fossil free investment strategy.
7 Appendix
a/ list of figures
1 GICS sub-industry exclusions for the ‘core’ portfolio (benchmark S&P 500 Index)
2 GICS sub-industry exclusions for the ‘core’ and ‘extended’ portfolios (benchmark S&P 500 Index)
3 GICS sub-industry exclusions for the ‘core’, ‘extended’ and ‘GFF’ portfolios (benchmark S&P 500 Index).
4 S&P 500 Index sector weightings over time. Only calendar year-end values are shown.
5 Number of constituents of the S&P 500 excluded from the three portfolios as in January 2009
6 Number of constituents of the S&P 500 excluded from the three portfolios as in December 2013
7 Number of companies excluded (2009-2013) in the three portfolios
8 Weighting in the S&P 500 Index of companies excluded (2009-2013) in the three portfolios
9 Morningstar Water Equity Sector (Europe) Benchmarks (by AuM)
10 Morningstar Agriculture Equity Sector (Europe) Benchmarks (by AuM)
11 Morningstar Agriculture Equity Fund performance (Europe)
12 The performance of the S&P 500 Index and the S&P 500 Index ex energy
13 Cumulative returns of ‘core’ portfolio against S&P 500 Index over one year (2013)
14 Cumulative returns of ‘core’ portfolio against S&P 500 Index over 3 years (2011-2013)
15 Cumulative returns of ‘core’ portfolio against S&P 500 Index over 5 years (2009-2013)
16 Rolling volatility of the ‘core’ portfolio over 12 months
17 Rolling volatility of the ‘core’ portfolio over 3 years
18 The 12 month rolling Sharpe Ratio for the ‘core’ portfolio and S&P 500 Index
19 Cumulative returns of ‘extended’ portfolio against S&P 500 Index over one year (2013)
20 Cumulative returns of ‘extended’ portfolio against S&P 500 Index over 3 years (2011-2013)
21 Cumulative returns of ‘extended’ portfolio against S&P 500 Index over 5 years (2009-2013)
22 Rolling volatility of the ‘extended’ portfolio over 12 months
23 Rolling volatility of the ‘extended’ portfolio over 3 years
24 The 12 month rolling Sharpe Ratio for the ‘extended’ portfolio and S&P 500 Index
25 Cumulative returns of ‘GFF’ portfolio against S&P 500 Index over one year (2013)
26 Cumulative returns of ‘GFF’ portfolio against S&P 500 Index over 3 years (2011-2013)
27 Cumulative returns of ‘GFF’ portfolio against S&P 500 Index over 5 years (2009-2013)
28 Rolling volatility of the ‘GFF’ portfolio over 12 months
29 Rolling volatility of the ‘GFF’ portfolio over 3 years
30 The 12 month rolling Sharpe Ratio for the ‘GFF’ portfolio and S&P 500 Index
b/ list of Tables
1 GICS sub-industry exclusions for the ‘core’ fossil free portfolio (benchmark S&P 500 Index).
2 GICS sub-industry exclusions for the ‘extended’ fossil free portfolio (benchmark S&P 500 Index).
3 GICS sub-industry exclusions for the ‘core’, ‘extended’ and ‘GFF’ portfolios (benchmark S&P 500 Index).
4 Cumulative active returns compared to the S&P 500 Index
5 Annualized returns & volatility and Sharpe ratios for the portfolios and the S&P 500 Index
6 Five largest positive contributors to cumulative active return in the ‘core’ portfolio
7 ‘Core’ portfolio attribution report from risk indices (annualized contributions)
8 Five largest negative contributors to cumulative active return in the ‘core’ portfolio
9 Five largest positive contributors to cumulative active return in the ‘extended’ portfolio
10 ‘Extended’ portfolio attribution report by industry (cumulative contribution)
11 Five largest negative contributors to cumulative active return in the ‘extended’ portfolio
12 Five largest positive contributors to cumulative active return in the ‘GFF’ portfolio
13 Five largest negative contributors to cumulative active return in the ‘GFF’ portfolio
Biographies
John Willis has 27 years of investment experience. Prior to joining SICM, John was a Managing Director at Deutsche Asset Management, where he served as the Global Head of Trading, Securities Lending, and Research. He was also Head of the Market Research Strategy Investment Team, which oversaw the management of eleven mutual funds. These funds covered a range of investment strategies including Global, European, Emerging Markets, and Value. Before DeAM, John held a number of sell-side roles at Deutsche Bank (2000–2005), Bankers Trust (1999–2000), NatWest Markets (1996–1999), Kleinwort Benson (1993–1996), and Yamaichi (1987–1993). John holds a Bachelors of Arts from Oxford University.
Paul Spence has 24 years of experience in the field of portfolio construction and risk management. Before joining SICM, Paul was Global Head of Risk and Portfolio Analytics at Deutsche Asset Management (2006–2012). He was also a Portfolio Manager for the global equity (developed and emerging markets) strategies. During Paul’s tenure, he developed and successfully implemented innovative analyst measurement systems. He was responsible for the delivery of a global, integrated risk management platform. His previous positions included: Head of Quantitative Research Asia-Pacific at Zurich-Scudder (1997–2006), SVP at Barra International (1994–1997), and Quantitative Analyst at Prudential Portfolio Managers (1989–1994). Paul holds a Bachelors of Applied Science (Mathematics) from University of Technology, Sydney.
About SICM
Sustainable Insight Capital Management (SICM) is an SEC-registered investment management firm that combines a disciplined security selection process with environmental, social and governance (ESG) principles. Our investment philosophy is founded on three core principles: (1) Analyst skill level is fundamental to delivering positive expected returns; (2) Environmental, Social, and Governance (ESG) factors are becoming increasingly material to asset valuations; (3) Minimizing common risk factors isolates security selection skill leading to improved expected positive alpha.
Launched in February 2013, SICM is striving to create the leading sustainable asset management platform. The firm was founded by Kevin Parker, CEO and Chairman of the Board. Kevin was a Member of the Management Board of Deutsche Bank for over 10 years and the former Global Head of Deutsche Asset Management from 2004–2012. Our partners include Capricorn Investment Group and The Kresge Foundation. Presently, we are 14 people with offices in New York (headquarters), London, and Sydney.