
Zsolt Simon, MSc; PhD candidate
Risk and Performance Analyst at Bank J. Safra Sarasin, Switzerland

Chiara Legnazzi, PhD
Risk and Performance Analyst at Bank J. Safra Sarasin, Switzerland
Disclaimer: This article is research in progress representing the opinions of the authors only as per the date of writing and may be changed at any time without notice. Neither the authors or Bank J. Safra Sarasin Ltd. nor third party sources and/or providers of information quoted make any warranties or representations of any kind relating to the accuracy, completeness, or timeliness of the data provided and shall have no liability for any damages of any kind relating to the use of such data, including but not limited to, for the use of the results of the studies for investment purposes. Reproduction of the article in whole or part in any form without the prior approval of the authors is prohibited.
Disclaimer for MSCI ESG Data: This report contains certain information (the “Information”) sourced from MSCI ESG Research LLC, or its affiliates or information providers (the “ESG Parties”). The Information may only be used for your internal use, may not be reproduced or re-disseminated in any form and may not be used as a basis for or a component of any financial instruments or products or indices. Although they obtain information from sources they consider reliable, none of the ESG Parties warrants or guarantees the originality, accuracy and/or completeness, of any data herein and expressly disclaim all express or implied warranties, including those of merchantability and fitness for a particular purpose. None of the MSCI information is intended to constitute investment advice or a recommendation to make (or refrain from making) any kind of investment decision and may not be relied on as such, nor should it be taken as an indication or guarantee of any future performance, analysis, forecast or prediction. None of the ESG Parties shall have any liability for any errors or omissions in connection with any data herein, or any liability for any direct, indirect, special, punitive, consequential or any other damages (including lost profits) even if notified of the possibility of such damages.
Disclaimer for MSCI Indices: Although MSCI shall obtain information for inclusion in the service from sources that MSCI considers reliable, the service is provided to licensee as is and neither MSCI, nor any of its affiliates, any of its or their direct or indirect information providers, nor any third party involved in, or related to, compiling, computing, or creating the service (collectively, the MSCI parties) makes any representation or warranty of any kind to licensee or any third party, either express or implied, with respect to the service, the timeliness thereof, the results to be obtained by the use thereof or any other matter. Further, the MSCI parties expressly disclaim, and licensee waives, any and all implied warranties, including, without limitation, warranties of originality, accuracy, completeness, timeliness, non-infringement, merchantability, and fitness for a particular purpose.
Abstract
To date, a great body of research has agreed on the benefits of sustainable investing on firm performance; however, its effects on portfolio risk are still rather unclear. This article aims to reconcile the existing literature on the impact of sustainability-related information with portfolio tail risk. When conducted not only at an E/S/G score level but also at a key issue level, the analysis enriches the existing literature on socially responsible investing. We propose a simple statistical methodology to identify the most-relevant sustainability-related information driving equity returns. Then, we compare the portfolio expected shortfall before and after the application of a tilt toward the sustainability-related information selected at the previous step. In this way, we assess whether relevant sustainability-related information carries benefits in terms of portfolio tail-risk mitigation. Results show that specific sustainability-related key issues explain the cross-sectional variance of equity returns—thus behaving as risk factors—and reduce portfolio tail risk. Most of the identified relevant ESG data are the same across the European and the U.S. equity markets. Nevertheless, their magnitudes and relative ranking within these markets are different, thus reflecting heterogeneities in terms of investors’ profiles, as well as the legal and regulatory frameworks of Europe and the United States.
ESG Risk Factors and Tail-Risk Mitigation
Over the last decade, an increasing number of companies and investors have committed to the integration of Environmental, Social, and Governance (ESG) information in their investment policies and capital allocation processes. Even though the importance of ESG data has been widely recognized, the identification of the most- or least-material ESG information and its relative effects on firms’ performance and risk is still an open debate.
Besides lacking a formal definition, the materiality of ESG key issues systematically varies both at a cross-sectional level (Eccles and Serafeim 2013) and over time, thus raising difficulties in the determination of an unambiguous and agreed-upon classification between material and immaterial information. To date, a great body of research has focused on the relationship between sustainable investing and firm performance; however, the impact of sustainable investing on portfolio risk has attracted less attention. Moreover, while there is a general agreement on the positive, or at least non-negative, effects of ESG investing on firm performance (Friede, Bush, and Bassen 2015; Khan, Serafeim, and Yoon 2016) and on the existence of a causality link among the two (Glassman, Potoski, and Callery 2017), evidence on the overall impact of ESG investing with respect to risk is still mixed. Even though a restriction of the available investment universe triggers a reduction in portfolio diversification (Renneboog, Horst, and Zhang 2008), ceteris paribus firms with higher ESG ratings seem to exhibit lower total (Lee and Faff 2009) and idiosyncratic (Hoepner 2010) risk.
Similarly, investment strategies based on ESG data carry benefits with respect to tracking error reduction (Davis, Balkissoon, and Heaps 2017) and tail-risk mitigation across both developed (Hoepner et al. 2018; Ilhan, Sautner, and Vilkov 2019) and emerging markets (Verheyden, Eccles, and Feiner 2016). Nevertheless, other studies have carried evidence about the lack of a causal relationship between ESG scores and risk reduction (Sassen, Hinze, and Hardeck 2015), or of a clear effect of ESG investing on the portfolio risk-adjusted performance (Oikonomou, Brooks, and Pavelin 2012).
This article aims at reconciling the existing literature on the role and the effects of ESG information on portfolio tail risk. The contribution of the research is twofold. First, we use a purely statistical methodology to assess the relevance of sustainability-related information. Letting the data speak for itself, we classify as relevant the ESG information that behaves as a priced risk factor, that is, ESG information that shows a persistent and significantly high explanatory power over the whole sample period. Second, by using key issue scores in addition to the combined ESG score and the Environmental, Social, and Governance pillar scores, this analysis is the first one investigating the risk mitigation effects of sustainability-related information at such a granular level. On a monthly frequency and over the sample period from January 2013 to December 2018, we regress each sustainability score on the monthly return of all stocks belonging to its relevant MSCI Index (either MSCI USA or MSCI Europe). After having ruled out possible collinearities with other traditional risk factors, we identify a subset of sustainability indicators behaving as risk factors. The tail-risk reduction capability is tested by comparing the change in the expected shortfall from the original reference MSCI index to that of an artificial portfolio obtained by tilting the reference index toward a specific sustainability indicator. For a selection of key issues, the tilted portfolio presents a lower tail risk, thus providing supportive evidence to the existence of tail-risk mitigation benefits of investing in specific sustainability-related factors.
In the first section, we introduce the Methodology used to identify the material sustainability key issues and to test the tail-risk mitigation hypothesis. The second section presents the Dataset and its relevant characteristics, and in the third section we show the Empirical Results in terms of significance and risk reduction both for the European and for the U.S. equity markets. Finally, we present our Conclusions.
Methodology
In this section, we identify which sustainability-related information is relevant in the explanation of equity stock returns. The analysis is performed in the context of a fundamental factor model using a variety of descriptors, such as the ESG score, three pillar scores (Environmental, Social, and Governance) and 34 key issue scores (Table 1).
Table 1: List of MSCI Key Issues
| List of Sustainability MSCI Key Issues | |
| Access to Commerce | Human Capital Development |
| Access to Finance | Climate Change Vulnerability |
| Access to Healthcare | Health & Demographic Risk |
| Anticompetitive Practices | Labor Management |
| Biodiversity & Land Use | Opportunities in Clean Technology |
| Business Ethics & Fraud | Opportunities in Green Building |
| Carbon Emissions | Opportunities in Nutrition & Health |
| Chemical Safety | Opportunities Renewable Energy |
| Controversial Sourcing | Packaging Material & Waste |
| Corporate Governance | Privacy & Data Security |
| Corruption & Instability | Production Carbon Footprint |
| Electronic Waste | Products Safety Quality |
| Energy Efficiency | Raw Material Sourcing |
| Financial Products Safety | Responsible Investment |
| Financial System Instability | Supply Chain Labor Standards |
| Financing Environmental Impact | Toxic Emissions & Waste |
| Health & Safety | Water Stress |
Source: Authors, 2019.
To reduce the sensitivity of the factor model to the choice of the independent variables (key issues and style factors like value, size, etc.) and the potential collinearities among them, we have opted for a univariate regression model to explain the cross-section of stock returns.
For each month, a cross-sectional regression using a fundamental factor model is performed for both the European and the U.S. equities comprising the MSCI Europe and the MSCI U.S. Indexes. The exposure of stock i to factor k is defined as a linear function of a score:

where ak,S and bk must be such that:

where N is the total number of stocks and S identifies the sector.
By imposing a null sum of the raw exposures within each sector, the first constraint ensures sector-neutrality and sets ak,S to be equal to the average raw score per sector. By setting a unit variance of the raw exposures, the scale is also standardized. To exclude any bias linked to the potential collinearities with other style factors, the style-neutral exposures (SNE) are calculated via the following linear regression:

where StyleExpi,l is the exposure to the traditional style factor l, with l = dividend yield, earning variability, growth, leverage, momentum, profit, size, trade activity, value, and volatility. Starting from the initial raw exposures, the style-neutral exposures SNEi,k are estimated via ordinary least squares (OLS) as the intercept of the linear regression model. Next, the returns associated with each factor, ft,k, are computed. In the setting of a factor model and a univariate regression, the return of each stock i can be expressed as:

where ft,k is the return of the factor k at time t, and ei,t,k is the residual return. From a theoretical point of view, SNEi,k should also be time dependent; nevertheless, as exposures vary slowly and the time horizon is sufficiently short (monthly), it is reasonable to consider them constant and equal to their value at the beginning of the return period. Hence, the return of factor k at time t equals the return of a long-short portfolio which buys SNEi,k/N of the stock i,

where N is the total number of stocks, and a positive/negative sign of SNEi,k indicates whether a position is long/short, respectively.
To evaluate the accuracy and the reliability of the factor regression, we rely on the adjusted R-squared[1] and the t-statistic metrics. We calculate the mean adjusted R-squared as the average of the adjusted R-squared over time (henceforth, we refer to this quantity as explanatory power) and we define as significance the percentage of times in which the absolute value of the t-statistic exceeds 1.645, the 95% quantile of the normal distribution. The explanatory power is used as a metric to classify the sustainability-related information: whenever it is larger than zero, a factor is deemed to be relevant.Adjusted R-squared is preferred to the (simple) R-squared as it takes into account the size dependence of the sample, that is the stock coverage of the scores.To evaluate the accuracy and the reliability of the factor regression, we rely on the adjusted R-squared[1] and the t-statistic metrics. We calculate the mean adjusted R-squared as the average of the adjusted R-squared over time (henceforth, we refer to this quantity as explanatory power) and we define as significance the percentage of times in which the absolute value of the t-statistic exceeds 1.645, the 95% quantile of the normal distribution. The explanatory power is used as a metric to classify the sustainability-related information: whenever it is larger than zero, a factor is deemed to be relevant.
Once the most-informative ESG data are identified, the last step of the analysis aims at testing the risk-reduction hypothesis of those at a portfolio level. The most-popular tail-risk metrics are the Value-at-Risk (VaR) and the Expected Shortfall (ES). As the latter captures the severity of tail losses and is a sub-additive risk measure (unlike the VaR, it is a coherent risk measure), we choose the Expected Shortfall to measure portfolio tail risk. More precisely, we derive and compare the ES of the reference MSCI Index with that of the same MSCI Index tilted toward a higher factor exposure. For each relevant factor k, the tilt is performed by adding the factor portfolio to the initial reference MSCI Index. To assess whether the application of a factor k tilt mitigates tail risk, we introduce the Tail-Risk Mitigation (TRM) ratio:
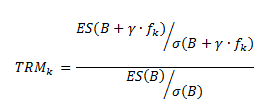
where B denotes the reference MSCI Index return, fk is the return of factor k, ES is the one month Expected Shortfall at 90% confidence level, ![]() is the volatility of the profit and loss distribution of the argument, and
is the volatility of the profit and loss distribution of the argument, and ![]() is the magnitude of the factor tilt applied to the MSCI Index. Whenever TRMk is lower than 1, factor k has mitigated the portfolio tail risk.
is the magnitude of the factor tilt applied to the MSCI Index. Whenever TRMk is lower than 1, factor k has mitigated the portfolio tail risk.
The sample period ranges from February 2013 to December 2018. The sample data include historical monthly equity returns, the time series of the monthly exposures of each company to the most-relevant style factors, and sustainability-related data. For all companies belonging to the MSCI Europe and MSCI United States Index, MSCI provides 71 monthly stock returns in local currency. For all European and U.S. companies in the sample, monthly exposures to style factors are obtained from the bank’s risk system, which uses market standard definitions. For each company, sustainability-related information concerning the monthly ESG and the 34 key issue scores are sourced from MSCI ESG; whereas E/S/G pillar scores are delivered by Bank J. Safra Sarasin’s internal model. Our study is primarily focused on Europe; nevertheless, the full analysis has been run for the United States equity market too.[2]
Empirical Results
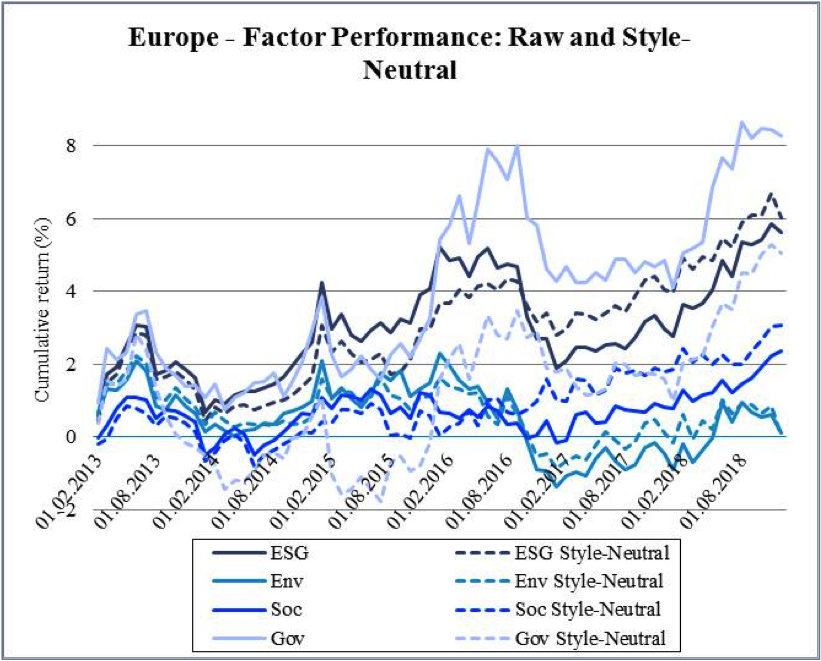
The methodology previously presented in this article is applied to the European and U.S. companies belonging to the MSCI Europe and MSCI U.S. Indexes. The cumulative factor returns are plotted both for the raw and style-neutral pillars and for the ESG scores in Europe (Figure 1). The style-neutralization has the strongest effect on the Governance pillar, whereas for the Environmental, Social, and ESG factors, its impact is not particularly relevant.
Figure 1: Cumulative Returns of Raw and Style-Neutral ESG and Pillar Factors Over the Period Feb. 2013–Dec. 2018
Source: Authors, 2019.
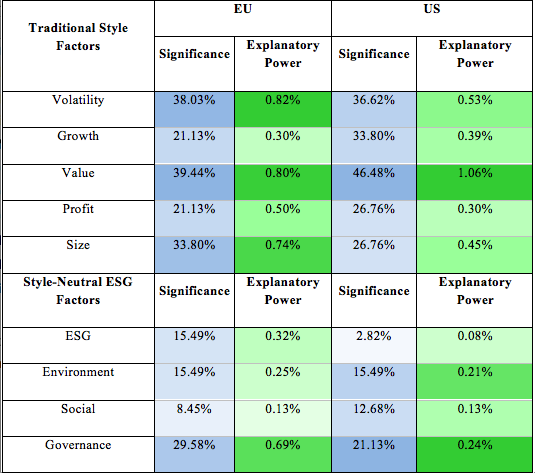
We investigated the strength of the ESG, pillar, and key issue factors in explaining stock returns. For both the European and the U.S. equity markets, we looked at the significance and the explanatory power for the style-neutral pillar scores and the ESG score (Table 2).
Table 2: Significance and Explanatory Power of Traditional Style Factors and Style-Neutral Pillar Scores and the ESG Score in Both Europe and the United States
Source: Authors, 2019.
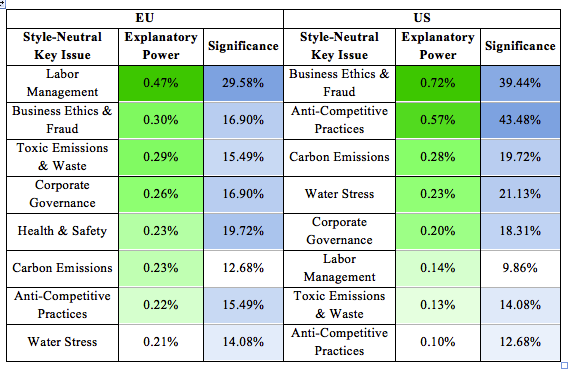
Explanatory power and significance go hand in hand: Explanatory power measures the ability of the risk factor to explain the variance, whereas significance is a measure of how certainly the factor is truly explaining variance. As expected, both the significance and the explanatory power of traditional style factors are, on average, larger than those of style-neutral ESG factors. Nevertheless, in Europe, values of the Governance pillar rank just below the median values of traditional style factors, and both the ESG and the Environment sustainability factors have an explanatory power close to that of the Growth style factor. Conversely, in the United States, the relevance of sustainability data is weaker, but the explanatory power of the Environment and the Governance pillar scores is still larger than 0.20%. Note the top eight style-neutral key issues with the highest explanatory power (Table 3). In Europe, Labor Management has by far the largest explanatory power, whereas in the United States, Business Ethics & Fraud ranks the highest. Despite the heterogeneities between the European and the U.S. equity markets, the identified most-relevant key issues coincide. Differences are instead reflected in the ordering and magnitudes of explanatory power. Thanks to the granularity of these results, it is possible to identify the most-relevant key issues across each market and calibrate more informative E/S/G pillars or even the whole ESG score accordingly.
Table 3: Significance and Explanatory Power of the Strongest Style-Neutral Key Issue Factors in Both Europe and the United States
Source: Authors, 2019.
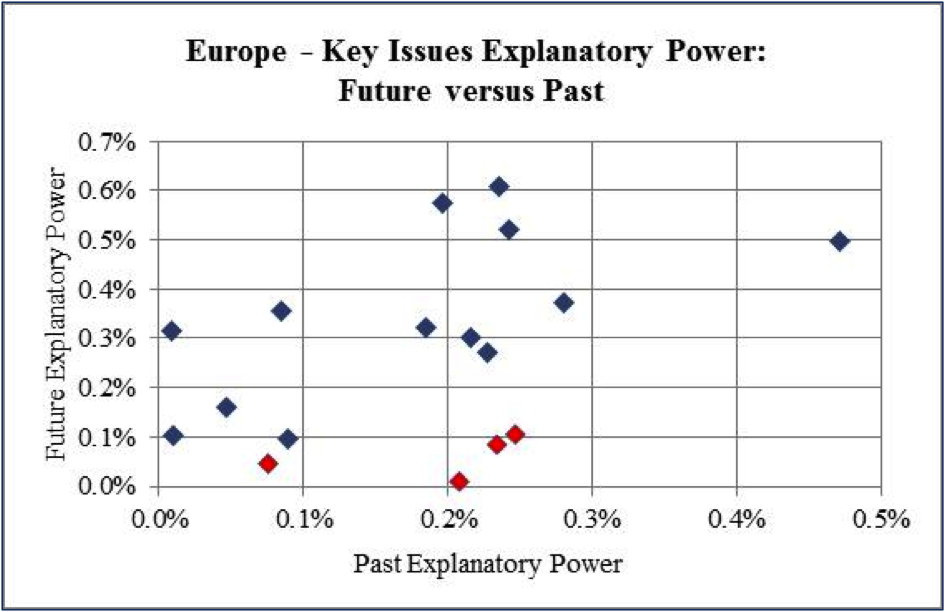
The persistency of the explanatory power is investigated by comparing the adjusted R-squared computed on the factor model regression over the sample period from February 2013 to December 2017, denoted as “past,” with the one over 2018, the last year of the sample period, denoted as “future.” In Europe most of the time, the explanatory power is persistent over time (Figure 2; data points in blue); style-neutral key issues with high explanatory power in the past tend to rank higher later.
Figure 2: “Future” versus “Past” Explanatory Power of Style-Neutral Key Issues in Europe
Source: Authors, 2019.
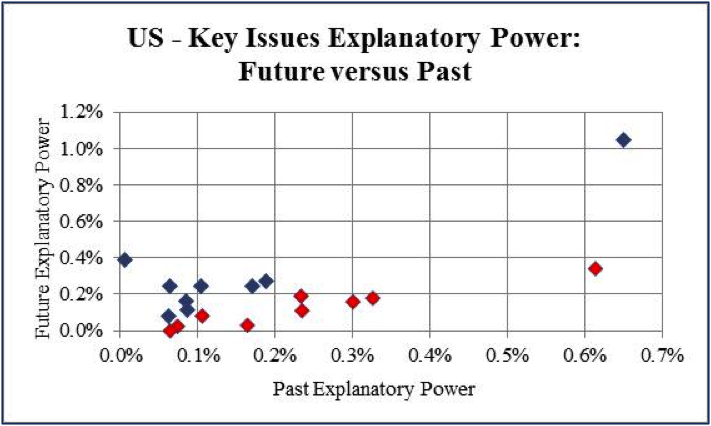
The results for the U.S. equity market are the same (Figure 3). Differently from the European case, persistence in the explanatory power of key issues in the U.S. case is less strong, as almost half of the key issues showed no persistency over the two sub-samples considered (data points in red).
Figure 3: “Future” versus “Past” Explanatory Power of Style-Neutral Key Issues in the United States
Source: Authors, 2019.
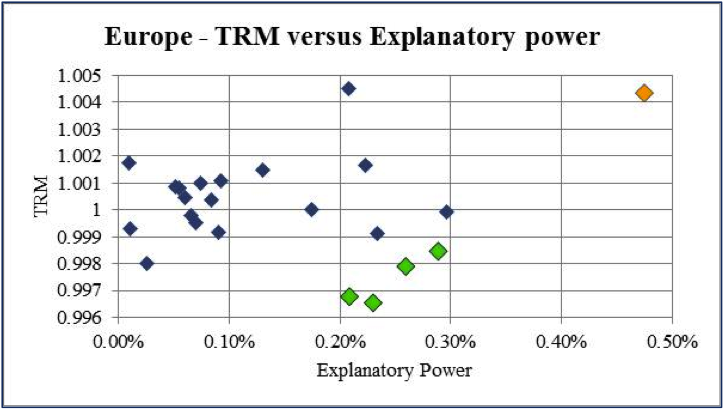
For each relevant[3] key issue in the European market, its tail-risk mitigation ratio and its explanatory power are plotted (Figure 4). Labor management (data point in orange) has the strongest explanatory power, but it does not mitigate tail risk. In green are those key issues that have relatively strong explanatory power and also mitigate tail risk: in Europe, Corporate Governance, Business Ethics & Fraud, Water Stress, and Toxic Emissions & Waste.
Figure 4: Explanatory Power and Tail-Risk Mitigation of Key Issue Factors in Europe
Source: Authors, 2019
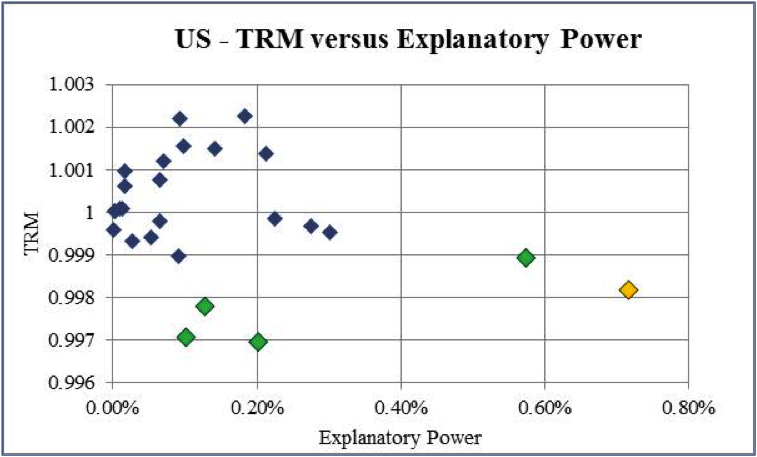
The results are the same for the U.S. equity market (Figure 5). In this case, the most-relevant key issue in terms of explanatory power, Business Ethics & Fraud (data point in orange), mitigates portfolio tail risk, too. As before, the most-relevant key issues in terms of explanatory power and TRM are highlighted in green, namely Anti-Competitive Practices, Corporate Governance, Toxic Emissions & Waste, and Health & Safety.
Figure 5: Explanatory Power and Tail-Risk Mitigation of Key Issue Factors in the United States
Source: Authors, 2019.
The analysis investigates the effects of sustainability-related information on portfolio tail risk. In the context of a fundamental factor model, we present a statistically based methodology to identify the most-relevant sustainability-related information driving equity returns. Breaking down the sustainability information to key issue granularity level, the analysis enriches the existing literature on socially responsible investing. Without relying on any subjective choice (other than the definition of the model structure), we detect relevant sustainability-related information based on a positive explanatory power resulting from factor univariate regression. Then, the tail-risk mitigation hypothesis is tested by comparing the expected shortfall before and after the application of a tilt toward informative sustainability-related data. Results show that a subset of ESG key issues and pillars shares similar characteristics in terms of explanatory power and significance to other risk factors well established in the literature. Among them, some actively contribute to portfolio tail-risk mitigation. The majority of the identified most-relevant key issues coincide across markets, even though their impact vary in magnitude from Europe to the United States, thus highlighting the structural differences between these two markets. Results can be of interest to academics, practitioners, and investors. For academics, they shed light on the potential benefits of relevant ESG information on portfolio tail risk, and for practitioners and investors, they provide useful guidelines for achieving a better portfolio diversification while improving the portfolio’s ESG characteristics.
Acknowledgements
We would like to thank the Head of the Asset Management, Treasury and Trading department at Bank J. Safra Sarasin, Daniel Belfer, and the members of the research and equity teams Dr. Jan A. Poser, Florian Esterer, and Pierin Menzli for their helpful comments on earlier drafts of this work. Besides our colleagues, we would like to thank Prof. Andreas Hoepner for his valuable and insightful comments.
Figures
Figure 1: Cumulative Returns of Raw and Style-Neutral ESG and Pillar Factors over the Period Feb. 2013–Dec. 2018 in Europe
Figure 2: “Future” versus “Past” Explanatory Power of Style-Neutral Key Issues in Europe
Figure 3: “Future” versus “Past” Explanatory Power of Style-Neutral Key Issues in the United States
Figure 4: Explanatory Power and Tail-Risk Mitigation of Key Issue Factors in Europe
Figure 5: Explanatory Power and Tail-Risk Mitigation of Key Issue Factors in the United States
Tables
Table 1: List of MSCI Key Issues
Table 2: Significance and Explanatory Power of Style-Neutral Pillar Scores and the ESG Score in Europe and in the United States
Table 3: Significance and Explanatory Power of the Strongest Style-Neutral Key Issue Factors in Europe and in the United States
References
Davis, B., K. Balkissoon, and T. Heaps. 2017. “Performance and Impact: Can ESG Equity Portfolios Generate Healthier Financial Returns?” The Journal of Environmental Investing 8(1): 252–272.
Eccles, R., and G. Serafeim. 2013. “The Performance Frontier: Innovating for a Sustainable Strategy.” Harvard Business Review 5: 50–60.
Friede, G., T. Bush, and A. Bassen. 2015. “ESG and Financial Performance: Aggregated Evidence from More than 2000 Empirical Studies.” Journal of Sustainable Finance & Investment 5(4): 210–233.
Glassman, D., M. Potoski, and P. J. Callery. 2017. “Missing Metrics that Matter to Investors: How Companies Can Develop ESG Financial Value Creation Metrics.” The Journal of Environmental Investing 8(1): 206–221.
Hoepner, A. 2010. “Portfolio Diversification and Environmental, Social or Governance Criteria: Must Responsible Investments Really Be Poorly Diversified?” Available from SSRN 1599334.
Hoepner, A., I. Oikonomou, Z. Sautner, L. T. Starks, and Y. X. Zhou. 2018. “ESG Shareholder Engagement and Downside Risk.” Working Paper.
Ilhan, E., Z. Sautner, and G. Vilkov. 2019. “Carbon Tail Risk.” Working Paper.
Khan, M., G. Serafeim, and A. Yoon. 2016 (November). “Corporate Sustainability: First Evidence on Materiality.” The Accounting Review 91(6): 1697–1724.
Lee, D. D., and R. W. Faff. 2009. “Corporate Sustainability Performance and Idiosyncratic Risk: A Global Perspective.” The Financial Review 44(2): 213–237.
Oikonomou, I., C. Brooks, and S. Pavelin. 2012. “The Impact of Corporate Social Performance on Financial Risk and Utility: A Longitudinal Analysis.” Financial Management. Available from https://doi.org/10.1111/j.1755-053X.2012.01190.x
Renneboog, L., J. Horst, and C. Zhang. 2008. “Socially Responsible Investments: Institutional Aspects, Performance, and Investor Behaviour.” Journal of Banking & Finance 32(9): 1723–1742.
Sassen, R., A. Hinze, and I. Hardeck. 2015. “Impact of ESG factors on firm risk in Europe.” Journal of Business Economics, Springer 86(8): 867–904.
Verheyden, R., R. E. Eccles, and A. Feiner. 2016. “ESG for All? The Impact of ESG Screening on Return, Risk and Diversification.” Journal of Applied Corporate Finance 28(2): 47–55.
Biographies
Zsolt Simon holds an MSc in particle physics from Eötvös University of Budapest. During his PhD studies in statistical physics, he taught quantitative subjects at Eötvös University. Mr. Simon worked at MSCI as quantitative researcher for six-plus years. From 2017 until 2019, he worked as Risk and Performance Analyst at Bank J. Safra Sarasin in Basel.
Chiara Legnazzi holds a PhD in finance from the Swiss Finance
Institute and the Università della Svizzera Italiana in Lugano. Her research
interests are in the fields of risk management and asset pricing. She has
published on these topics, including in the International
Journal of Finance & Economics and the Journal of Forecasting. Since
July 2018, she has worked as Risk and Performance Analyst at Bank J. Safra
Sarasin in Basel. She can be reached at Bank J. Safra Sarasin AG,
Elisabethenstrasse 62, CH-4002 Basel, Switzerland. Tel: +41 58317 4382. Email: Chiara.Legnazzi[at]jsafrasarasin[dot]com.
[1] Adjusted R-squared is preferred to the (simple) R-squared as it takes into account the size dependence of the sample, that is the stock coverage of the scores.
[2] Due to length constraints, some results for the United States have been omitted in the main body of the paper, but are available upon request.
[3] All those style-neutral key issues with strictly positive adjusted R-squared.

