
Mette Emsholm Kjær, MSc
ESG Analyst at responsAbility Investments AG
Abstract
Assessing and managing companies’ climate-change-related investment impacts and risks require a detailed understanding of their greenhouse gas (GHG) emissions. Yet for many companies, the dominant source of GHG emissions is indirect emissions that appear outside the company’s main operating space (Hertwich and Wood 2018; EIT Climate-KIC 2018b). Of the 15 supply-chain emission categories defined by the Greenhouse Gas (GHG) Protocol, this paper focuses on companies’ upstream and downstream transportation and distribution supply chains (Categories 4 and 9). Here, a quantitative model has been developed to estimate the GHG emissions from these categories.
The model has been developed with a company agnostic top-down approach, and is based on validated secondary data. Upstream and downstream transportation and distribution GHG emissions data reported from the Carbon Disclosure Project (CDP) are applied as benchmark data for calibration of the model.
The results of the calculations of the
model show a moderate positive linear correlation between calculated and
reported Category 4 and Category 9 emissions. The model gives the potential
user comparable and transparent data on transportation- and distribution-related
GHG emissions currently occurring from 22,000 companies’ supply chains. This information
can be applied in assessing climate-change-related risks and impacts of
investments. Additionally, the model contributes
a scalable alternative to the time-consuming bottom-up life-cycle assessment (LCA)
or the application of the inadequate CDP-reported data for supply-chain
emission estimation.
Development of a Quantitative Model for the Top-Down Estimation of Greenhouse Gas Emissions from Transportation and Distribution Activities of Companies’ Supply Chains
The already acknowledged worldwide implications of climate change have correspondingly begun to affect the financial industry. Efforts to address climate change-such as the introduction of mitigation policies (for example, carbon pricing; European Union 2015); demands for GHG emission reductions in industries (for example, National Determined Contributions; UNFCCC 2018); and shifts in consumer demands-are starting to have an impact on the valuation of companies (Ottman 2011; Hertwich and Wood 2018). Consequently, these efforts are resulting in potential investment risks to companies (McCarthy et al. 2001; Bracking 2015; Wolfrom 2015). Yet, financial models and tools that contain structured and systematically organized climate impact and risk information that would redirect investments into companies with low climate-change-related investment risks and impacts are still scarce (GHG Protocol 2011; EIT Climate-KIC 2018a). Due to this lack of information derived from companies on GHG emissions, there is a strong need to establish quantitative models to estimate the GHG emissions occurring in the supply chains of companies. Estimating the emissions on a top-down level can give investors access to comparable and transparent data on emissions occurring in companies’ supply chains.
Currently, most regulatory climate risk and opportunity assessments on an enterprise level depend on direct and indirect GHG emissions that occur within the company’s operational perimeter. These are called Scope 1 and Scope 2 GHG emissions by the GHG Protocol (Figure 1; 2011). They are typically calculated by applying a time-consuming and expensive bottom-up life-cycle analysis (LCA; Jacquemin 2012). However, research shows that upstream and downstream emissions appearing outside the company’s main operating space, the so-called Scope 3 GHG emissions, are the dominant source of GHG emissions for most economic activities (Downie and Stubbs 2013; Zah 2015).
Figure 1: Scopes and Emissions*
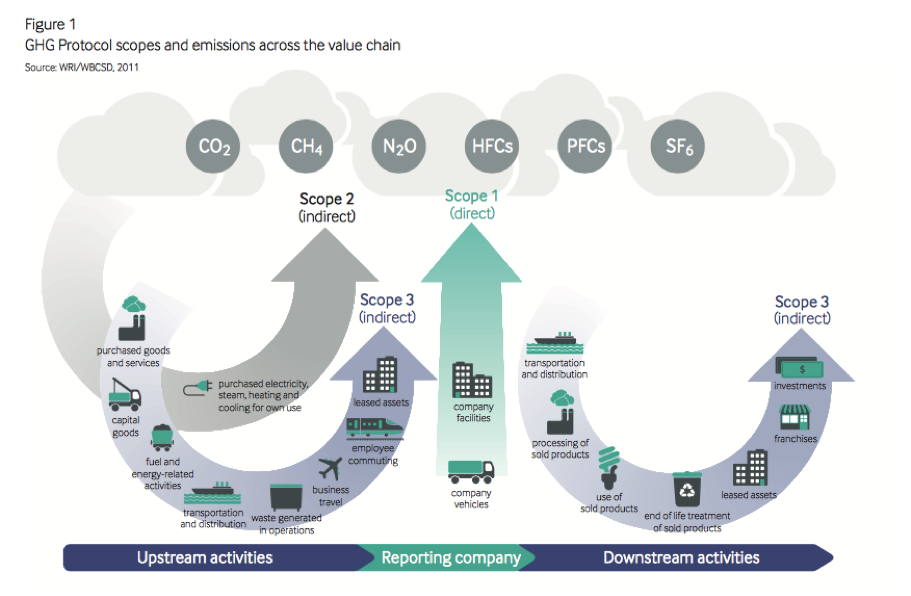
Source: GHG Protocol. 2011, 31.
*Scope 1, Direct emissions; Scope 2, indirect emissions by electricity purchase; Scope 3, indirect emissions via the supply chain of a company, as defined by the GHG Protocol (2011).
Because of this emphasis on emissions within operations, many company investments are based on limited and potentially misleading information that only partially reflects the size of the carbon footprint and climate risks or opportunities of a company (Hertwich and Wood 2018).
Significant contributors to the supply-chain GHG emissions are activities related to transportation and distribution, which cover more than 10% of total supply-chain emissions (CDP 2018). Transportation services are energy intensive, especially as oil is being consumed and combusted, resulting in high GHG emissions (Weidema 2013). Transportation as a whole accounts for more than 20% of the world’s GHG emissions, and freight transportation contributes to a substantial degree (Auvinen 2014). Even with existing safety regulations such as dot verification in place, there are grounds for improvement. Transportation-related emissions by 2030 are expected to grow by 50%, and by 100% by 2050, compared to their 2007 level (Craig, Blanco, and Sheffi 2013). Because transportation is already contributing to a company’s GHG emissions, and is expected to contribute increasingly, it is essential to understand the emissions from this source (Stadler 2018).
Current models or research projects estimating companies’ supply-chain emissions are limited (GHG Protocol 2011). The state-of-the-art research and models for estimating GHG emissions from freight transportation can only allocate the emissions on sectoral or national level (Cadarso et al. 2010; Andersen et al. 2010; Cristea et al. 2012; Auvinen et al. 2014). Using these models to derive information on companies’ GHG emissions is difficult, because the models are not linked to company-specific values or information.
This developed model can estimate transportation- and distribution-related emissions from companies’ supply chains. The emissions are assigned to the companies paying for or causing the transportation activity by linking the extent of emissions to company revenue data. Currently the method is applicable to 22,000 publicly traded companies and scalable to even more.
Methodology
The model is built with a distance-based approach, recommended by the GHG Protocol (2013). This approach includes activity data for transportation and incorporates mass, distance, mode of transportation and emission factors for the transportation modes. According to the GHG Protocol, the definitions of Categories 4 and 9 are
Category 4
Transportation and distribution of products purchased by the reporting company in the reporting year between a company’s tier 1 suppliers and its own operations (in vehicles and facilities not owned or controlled by the reporting company). (GHG Protocol 2013, 8)
Category 9
Transportation and distribution of products sold by the reporting company in the reporting year between the reporting company’s operations and the consumer (if not paid for by the reporting company), including retail and storage (in vehicles and facilities not owned or controlled by the reporting company). (GHG Protocol 2013, 9)
Companies A and B illustrate how the categories differ. The emissions occurring for company B are the upstream transportation and distribution emissions, and for company A, they are the downstream transportation and distribution emissions (Figure 2).
Figure 2: Distinguishing the Upstream and Downstream Transportation and Distribution Emissions
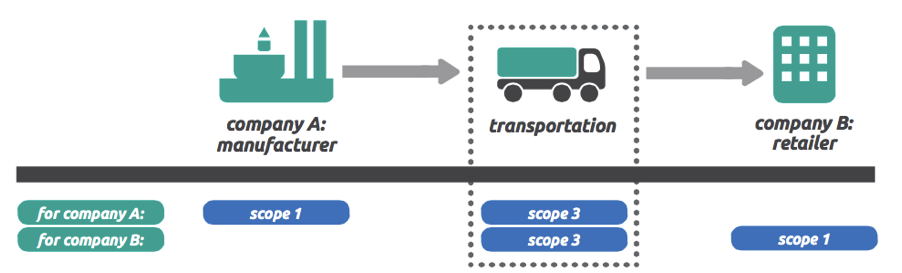
Source: GHG Protocol. 2011, 108.
Developing a model with a top-down approach requires a parent methodology, where companies are grouped into sectors. The model has therefore been developed on a company agnostic approach. The model distinguishes between transportation patterns in different sectors. The sectors are used as a proxy for how a specific company within a certain sector performs regarding transportation activities. Companies are hence mainly distinguished by which sectors they operate in, and the annual revenue created within specific sectors and specific countries.
Data Sources
Trade data is extracted from the Exiobase Multiregional (MRIO) database, which contains a multiregional input–output table with intra- and intersectoral and intra- and intercountry trade values. Here, revenue and traded value of the traded products have been found, extracted, and linked to weight data (Tukker 2013). Data on “weight-per-traded-value” has been extracted from the International Trade Map (ITC 2018).
The distance between the represented countries has been calculated as follows: The capital or main economic center has been used as the representative start- and end-point for the transportation activity (Mayer and Zignago 2011; Bertoli, Goujon, and Santoni 2016).
Data on the most-used transportation mode (including trucking, rail, marine shipping, flight, and pipeline) for different sectors has been extracted from the ecoinvent transportation database. The emission factor in tonnes CO2eq/tonne*km per transportation mode has been extracted from IPCC’s emission factor database (Wernet 2016; Borken-Kleefeld 2012; IPCC 2013).
This emission data from transportation activities per sector has been matched to revenue breakdown of company activities per country and sector. The data is extracted from Carbon Delta (2018; Factset 2018). With the data, it has been possible to calculate and estimate GHG emissions for the 4 and 9 Scope 3 categories from companies’ supply chains (Figure 3).
Figure 3: The Methodology of the Development of the Model (programmed in Python)
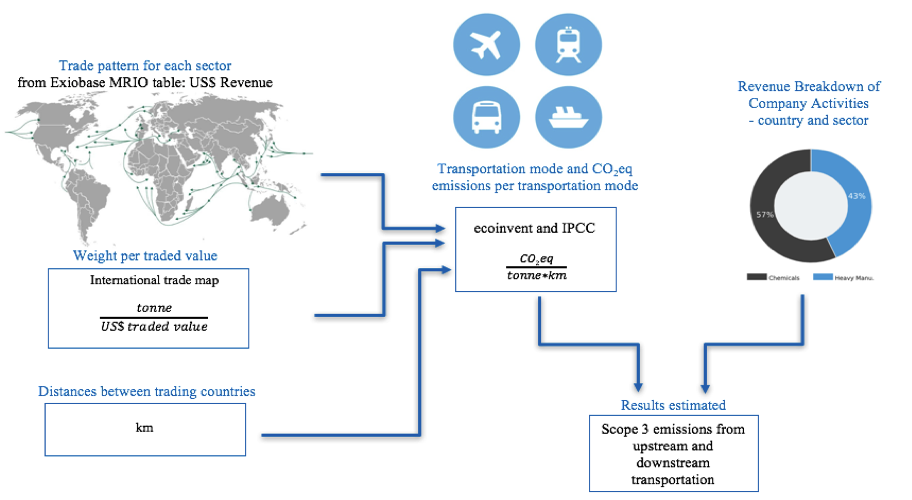
Source: Developed by author, 2019.
The calculated emissions have been compared to the Categories 4 and 9 emission data from 70 companies reporting to the CDP (2018).
Results
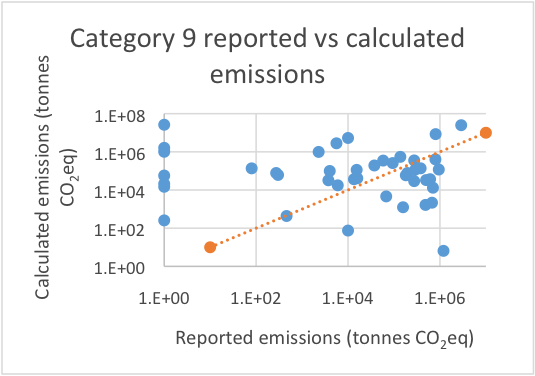
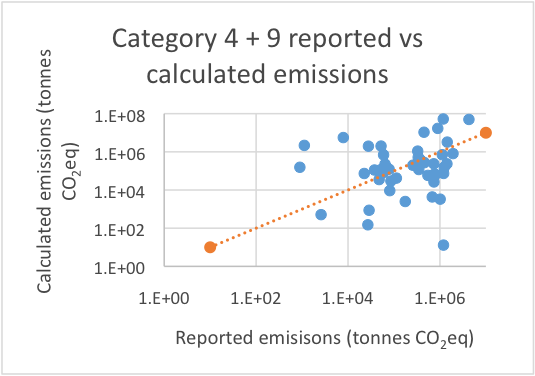
The correlation between the calculated emissions and the CDP-reported emissions can be seen in Figure 4. Here, the modeled emissions are validated against CDP-reported emissions, and mapped in a logarithmic scale. The emissions have been grouped, respectively, into Category 4, Category 9, and Category 4 + 9. The calculated correlation coefficient for Category 4 is 0.5, for Category 9, 0.5, and for Category 4 and 9 combined, 0.6. Consequently, there is a moderate positive-linear relation between the reported and the calculated emissions. The model both underestimates and overestimates the emissions for the two categories and the combined categories. Here, the mapped dots (representing the calculated versus reported emissions) are distributed both over and under the x=y line. The x=y line represents the perfectly fitting correlation line. Companies that could not be assigned emissions due to lack of data are not mapped in the graph.
Figure 4: Modeled GHG Emissions Validated against CDP-Reported Emissions in a Logarithmic Scale Respectively for Category 4, Category 9, and Category 4 + 9 (The orange line represents the x=y and the small blue line represents a linear trend line.)
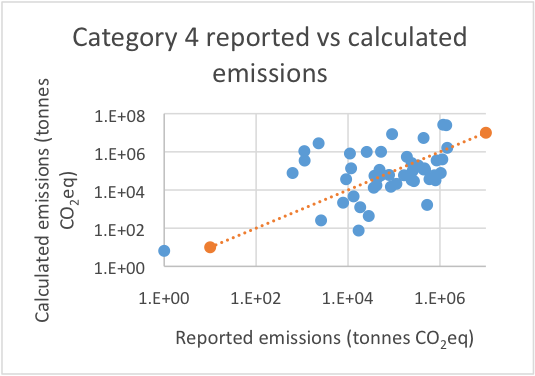
Source: Developed by author, 2019.
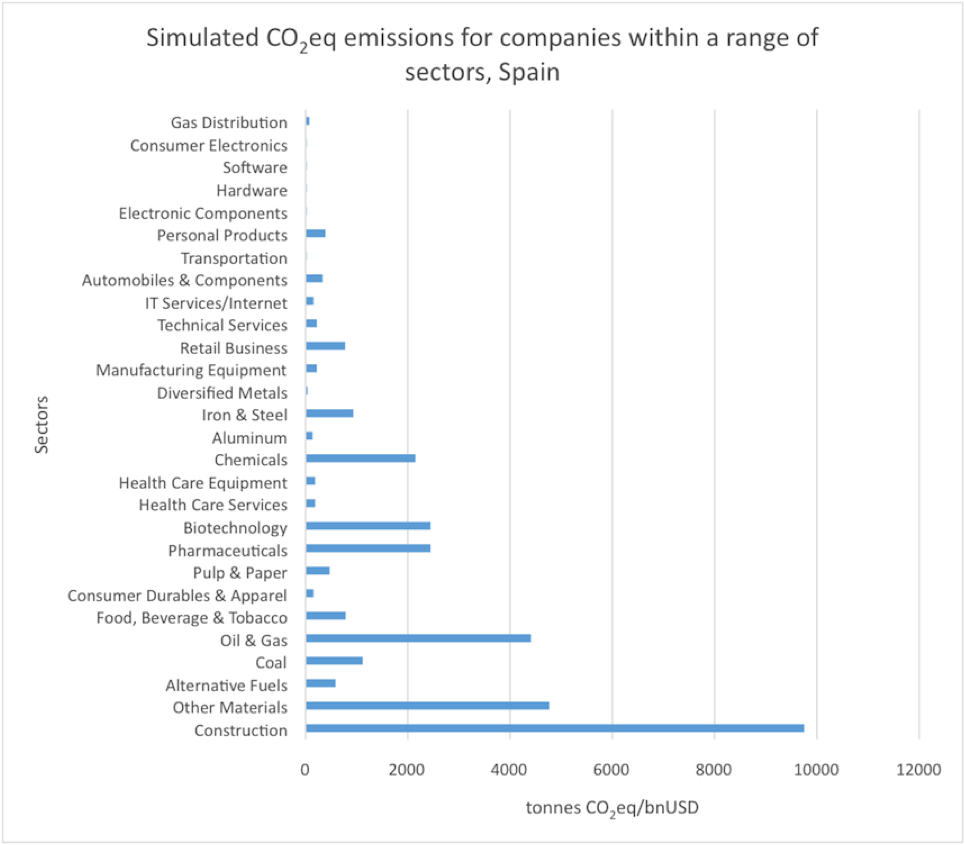
By conducting a t-test, the p-value is 0.10 for Category 4, 0.07 for Category 9, and 0.20 for Category 4 and 9 combined. Under the null hypothesis, assuming that the two data samples are similar (having the same mean) and significance level of alpha = 0.05, the outcome of the t-test (p-value > 0.05) indicates that I cannot reject the null hypothesis. The observed difference between the samples means (outcome of the two sample t-tests) is not convincing enough to say that the means of the two samples differ significantly. The range of simulated companies operating in the different sectors demonstrates how the developed model differentiates GHG emissions among companies operating within different sectors (Figure 5). Here, Spain has been chosen as an illustration. GHG emissions are reported in tonnes CO2eq/bnUSD.
Figure 5: Simulated Upstream and Downstream CO2eq Emissions for Companies within a Range of Sectors in Spain (A number of companies within the tertiary industry have an emission factor of 0 or very low and are not presented in this table.)
Source: Developed by author, 2019.
The sectors with the highest GHG emissions are typically the sectors transporting heavy products and goods (for example “Construction” and “Oil and Gas”), or products and goods that are typically transported with a transportation mode, which has a high GHG emission factor (for example, flight). These sectors are typically “Chemicals,” “Biotechnology” and “Pharmaceuticals.” The observed tendencies in sectors with high GHG emissions correlates with the assumptions suggested by McKinnon (2007) and by Cadarso et al. (2010).
Discussion
The model builds on a combination of different databases, where each of the databases are used as a proxy for how different countries and sectors trade internally, transport their goods, how far, and with what transportation mode.
Application of Secondary Databases for the Development of the Model
Adding up assumptions and uncertainties from many different data sources led to an accumulation of uncertainty in the model. As the sector segregation does not match across all applied databases, additional uncertainty is added to the model output.
Moreover, applying secondary databases and using them in a company-agnostic way yields average GHG emissions for different sectors. Consequently, only their annual revenue will distinguish companies operating in the same sector. This means that for companies with comparably high or low transportation activities within the sector, the model will under- or overestimate their GHG emissions, respectively.
Furthermore, the secondary data cannot distinguish whether individual companies are mainly trading locally or globally. The modeling does not take into account whether companies within the same sector are trading and thus transporting their goods differently.
Linking Emissions to Revenue Data
The assumption that emissions from transportation activities relate to annual revenue is supported by the fact that companies with a high revenue most likely have a high business activity and hence, more products or goods are sold and being transported (Andersen et al. 2010; ITF 2015). However, this assumption is not generally valid for companies within the tertiary industry, where revenue is often created from immaterial products. This includes, for example, companies within the financial, telecommunication, consultancy, or education sectors. It can also be difficult to group companies unambiguously.
The International Trade Map and the ecoinvent database (ITC 2018;Wernet 2016) do not contain data for all sectors represented in Carbon Delta and Exiobase. This is the case for several sectors within the tertiary industry, such as the financial sector and service sectors. It has therefore not been possible to model transportation-related GHG emissions for many companies within the tertiary industry.
For future modeling, an estimation of emissions for sectors within the tertiary industry could be applied to assign emissions for sectors where data has not been available. To this end, examining emissions in a bottom-up approach from a sample of companies within these missing sectors could help to quantify possible emissions.
Scope 3 versus Scope 1 Emissions from Companies’ Transportation Activities
The model developed here builds on the assumption that transport activities related to one company are performed by another company. This means that all the trade and related transportation data extracted from the Exiobase database have been assigned to Scope 3 emissions.
Companies could potentially own their vehicle operation systems (VOS), where the emissions from these VOS would count as Scope 1 emissions. It was impossible to assess which companies own their transportation vehicles. Yet, as freight transportation for companies is-to a large extent-managed by transportation service companies (ITF 2015), the assumption is potentially plausible. The assumption can lead to a small overestimation of GHG emissions from transportation and distribution activities for some specific companies.
In order to avoid this overestimation for future modeling purposes, an examination of sectors where the companies’ ownership of their transportation vehicles is more common could be made, and afterwards integrated in the model.
Applying Several Databases with Different Assumptions to Databases from Different Years
The applied databases are generally from different years in the 2010s, and all are associated with assumptions and/or uncertainties. These factors can skew data output, resulting in both potential under- and overestimations. But because of the awareness that assumptions and uncertainties can lead to this skewed data output, the scope of the thesis has not been to calculate the exact emissions, but rather to quantify possible GHG emissions for companies.
It has not been possible to find databases that were developed from the exact same years, with the result that their base years vary from 2011 to 2018. But the newest data from the different chosen data sources has always been applied. Therefore, the applied data sources express different tendencies on trade and transportation patterns when compared to the actual transportation pattern in 2017 (the base year of the CDP database to which the results of the model have been compared). For more accurate calculations in future models, updated databases, preferably from the same years, should be applied once they are available.
Comparing the Data with Benchmark Data from CDP
As part of the model development, modeled emissions are validated against the reported CDP emissions. There is a moderate positive correlation coefficient (+0,6) between the calculated and reported data. The fact that these two datasets are not correlating to a high degree (>0,9) can partly be explained by the several previously mentioned reasons and by the fact that the CDP data is also associated with errors (Stanny 2018; Sullivan 2009). There is a chance that my model potentially provides more accurate emissions data than the reported emissions. The CDP-reported data has nevertheless been used as benchmark data, because it is the only accessible data on Scope 3, Categories 4 and 9 emissions.
In order to investigate whether the data is representative, a sensitivity analysis could advantageously be applied for future research. Such an analysis could be applied to predict the outcome of a decision based on a certain range of variables. By applying this analysis, it can be determined if and how changes in one variable will affect the data outcome. This could help to identify which parameters of the model have the biggest decisive force, and clarify in which parts of the model extra attention should be given regarding the quality of the applied data.
Conclusion
This paper is written as a result of the development and contribution of a quantitative model to estimate indirect GHG emissions of companies in a top-down approach. Of the 15 supply-chain categories defined by the GHG Protocol, the developed model contains the two: Category 4: Upstream Transportation and Distribution, and Category 9: Downstream Transportation and Distribution.
The model is built on a company agnostic top-down approach based on validated secondary data. The results of the calculations show a moderate positive linear correlation between calculated and reported Scope 3 emissions.
The model can, combined with the modeling of the other 13 categories defined by the GHG Protocol (2011a; 2018a), give the full overview of possible GHG emissions occurring in 22,000 companies’ supply chains. This can give investors and asset managers access to comparable and transparent data on probable emissions occurring from these companies’ supply chains. This data can thus improve investors’ assessments of climate-change-related risks, enabling them to invest in the companies with lower GHG emissions and thereby reduce the risk of financial losses.
Moreover, with this project, a new methodology is proposed for how emissions from companies’ supply-chain transportation and distribution can be calculated in a scalable, top-down approach. This is in contrast to current state-of-the-art models that can only estimate and allocate freight transportation GHG emissions on a sectoral or national level. In addition, the model gives a transparent and scalable alternative to the current CDP database, where data is associated with errors, and to the bottom-up LCA approach, which is time-consuming and difficult to scale.
References
Andersen, O., S. Gössling, M. Simonsen, H. J. Walnum, P. Peeters, and C. Neiberger. 2010. CO2 Emissions from the Transport of China’s Exported Goods. Energy Policy 38: 5790–5798. Available from https://doi.org/10.1016/j.enpol.2010.05.030.
Auvinen, H., U. Clausen, I. Davydenko, D. Diekmann, V. Ehrler, and A. Lewis. 2014. “Calculating Emissions Along Supply Chains-Towards the Global Methodological Harmonisation.” Research in Transportation Business & Management 12: 41–46. Available from https://doi.org/10.1016/j.rtbm.2014.06.008.
Bertoli, S., M. Goujon, and O. Santoni. 2016. “The CERDI Sea Sistance Database.” Etudes et Documents 7.CERDI. Accessed 15/10-2+18. Available from http://cerdi.org/production/show/id/1791/type_production_id/1.
Borken-Kleefeld, J. 2012. “Default Transport Data per Commodity Group for the US and EU27-Methodology and Notes on Data for ecoinvent.” Zürich, Switzerland: ecoinvent Centre.
Bracking, S. 2015. “Performativity in the Green Economy: How Far Does Climate Finance Create a Fictive Economy?” Third World Quarterly 36(12): 2337–2357. Available from https://doi.org/10.1080/01436597.2015.1086263.
Cadarso, M., L. López, N. Gómez, and M. Tobarra. 2010. CO2 Emissions of International Freight Transport and Offshoring: Measurement and Allocation. Ecological Economics 69: 1682–1694. Available from doi: 10.1016/j.ecolecon.2010.03.019.
Carbon Delta. 2018. Carbon Delta: The Environmental Fintech. Accessed on September 24, 2018. Available from https://www.carbon-delta.com.
Carbon Disclosure Project (CDP). 2018. Closing the Gap: Scaling up Sustainable Supply Chains. CDP: CDP Supply Chain Report 2017 / 2018.
Craig, A. J., E. E. Blanco, and Y. Sheffi. 2013 (July). “Estimating the CO2 Intensity of Intermodal Freight Transportation.” Transportation Research Part D: Transport and Environment 22: 49–53. Available from doi: 10.1016/j.trd.2013.02.016.
Cristea, A., D. Hummels, L. Puzzello, and M. Avetisyan. 2012. “Trade and the Greenhouse Gas Emissions from International Freight Transport.” Journal of Environmental Economics and Management 65(1): 153–173. Available from doi.org/10.1016/j.jeem.2012.06.002.
Downie, J., and W. Stubbs. 2013. “Evaluation of Australian
Companies’ Scope 3 Greenhouse Gas Emissions Assessments.” Journal of Cleaner Production 56:
156–163. Available from doi.org/10.1016/j.jclepro.2011.09.010.
EIT Climate-KIC (Knowledge and Innovation Community). 2018a. “Decision Metrics and Finance: Unlocking Finance for Climate Action.” Supported by the European Institute of Innovation and Technology (EIT), a body of the European Union. Accessed October 30, 2018. Available from https://www.climate-kic.org/areas-of-focus/decision-metrics-finance/overview/.
EIT Climate-KIC. 2018b. “Curbing Carbon Emissions in Company Value Chains.” Supported by the EIT, a body of the European Union. Accessed August 11, 2018. Available from https://www.climate-kic.org/news/carbon-emissions-in-value-chains/.
European Union. 2015. EU ETS Handbook: Climate Action. European Union. Available from https://ec.europa.eu/clima/sites/clima/files/docs/ets_handbook_en.pdf.
Factset. 2018. Factset Products and Data. Accessed September 24, 2018. Available from https://www.factset.com/products-data.
GHG Protocol. 2011. Corporate Value Chain (Scope 3) Accounting and Reporting Standard, Supplement to the Greenhouse Gas Protocol Corporate Accounting and Reporting Standard. World Resources Institute & World Business Council for Sustainable Development.
GHG Protocol; the Carbon Trust; and World Resources Institute (WRI). 2013. Greenhouse Gas Protocol: Guidance for Calculating Scope 3 Emissions, Supplement to the Corporate Value Chain (Scope 3) Accounting & Reporting Standard. World Resources Institute (WRI) and the World Business Council for Sustainable Development (WBCSD).
Hertwich, E. G., and R. Wood. 2018. “The Growing Importance of Scope 3 Greenhouse Gas Emissions from Industry.” Environmental Research Letters 13(10). Available from doi: 10.1088/1748-9326/aae19a.
Intergovernmental Panel on Climate Change (IPCC). 2013. GWP 100a V1 03, Emission Factor Database (EFDB). Intergovernmental Panel on Climate Change: Task Force on National Greenhouse Gas Inventories. Accessed November 26, 2018. Available from https://www.ipcc-nggip.iges.or.jp/EFDB/find_ef.php?ipcc_code=1.A.3.b.iii&ipcc_level=4.
International Trade Centre (ITC). 2018. International Trade Map. Trade statistics for international business development. International Trade Centre (ITC), in cooperation with the European Union commission;The United Nations Conference on Trade and Development; and the World Trade Organization.Accessed September 24, 2018. Available from https://www.trademap.org/Index.aspx.
International Transport Forum (ITF). 2015. The Carbon Footprint of Global Trade: Tackling Emissions from International Freight Transport. Organisation for Economic Co-operation and Development (OECD)/ITF.
Jacquemin, L., P. Pontalier, and C. Sablayrolles. 2012. “Life Cycle Assessment (LCA) Applied to the Process Industry: A Review.” The International Journal of Life Cycle Assessment 17(8): 1028–1041. Available from doi: 10.1007/s11367-012-0432-9.
Mayer, Thierry, and Soledad Zignago. 2011. “Notes on CEPII’s Distances Measures: The GeoDist Database.” CEPII Working Paper 2011-25 (December).
McCarthy, J., O. Canziani, N. Leary, D. Dokken, and K. White, eds. 2001. Climate Change 2001: Impacts, Adaptation and Vulnerability. Contribution of Working Group II to the Third Assessment Report of the Intergovernmental Panel on Climate Change (IPCC). Cambridge, UK: Cambridge University Press (published for the IPCC).
McKinnon, A. 2007. CO2 Emissions from Freight Transport in the UK. Report prepared for the Climate Change Working Group of the Commission for Integrated Transport. Edinburgh: Logistics Research Centre Heriot-Watt University. Available from doi: 10.13140/RG.2.2.10866.81600.
Organisation for Economic Co-operation and Development (OECD). 2018. Purchasing power parities (PPP) (indicator). doi: 10.1787/1290ee5a-en. Accessed Novemeber 28, 2018. Available from https://data.oecd.org/conversion/purchasing-power-parities-ppp.htm#indicator-chart.
Ottman, J. 2011. The New Rules of Green Marketing: Strategies, Tools, and Inspiration for Sustainable Branding. London: Routledge (Greenleaf Publishing).
Stadler, K., R. Wood, T, Bulavskaya, C-J. Södersten, M. Simas, S. Schmidt, A. Usubiaga, J. Acosta-Fernández, J. Kuenen, M. Bruckner, S. Giljum, S. Lutter, S. Merciai, J. H. Schmidt, M. C. Theurl, C. Plutzar, T. Kastner, N. Eisenmenger, K-H. Erb, A. de Koning, and A. Tukker. 2018. “EXIOBASE 3: Developing a Time Series of Detailed Environmentally Extended Multi?Regional Input–Output Tables.” Journal of Industrial Ecology 22(3): 502–515. Available from doi: org/10.1111/jiec.12715.
Stanny, E. 2018. “Reliability and Comparability of GHG Disclosures to the CDP by U.S. Electric Utilities.” Social and Environmental Accountability Journal 38(2): 111–130. Available from doi: 10.1080/0969160X.2018.1456949.
Sullivan, R. 2009. “The Management of Greenhouse Gas Emissions in Large European Companies.” Corporate Social Responsibility and Environmental Management 16(6): 301–309. Available from doi:10.1002/csr.187.
Tukker, A., A. de Koning, R. Wood, T. Hawkins, S. Lutter, J. Acosta, J. M. Rueda Cantuche, M. Bouwmeester, J. Oosterhaven, T. Drosdowski, and J. Kuenen. 2013. “Exiopol-Development and Illustrative Analyses of a Detailed Global MR EE SUT/IOT.” Economic Systems Research 25(1): 50–70. Available from doi: 10.1080/09535314.2012.761952
United Nations Framework Convention on Climate Change (UNFCCC). 2018. “Nationally Determined Contributions (NDCs): The Paris Agreement and NDCs.” Accessed September 19, 2018. Available from https://unfccc.int/index.php/process/the-paris-agreement/nationally-determined-contributions/ndc-registry.
Weidema, B. P., C. Bauer, R. Hischier, C. Mutel, T. Nemecek, J. Reinhard, C. O. Vadenbo, and G. Wernet. 2013. Overview and Methodology: Data Quality Guideline for the ecoinvent Database Version 3. ecoinvent Report No. 1 (v3). St. Gallen, Switzerland: The ecoinvent Centre.
Wernet, G., C. Bauer, B. Steubing, J. Reinhard, E. Moreno-Ruiz, and B. P. Weidema. 2016. “The ecoinvent Database Version 3 (part I): Overview and Methodology.” The International Journal of Life Cycle Assessment 21(9): 1218–1230. Available from doi: 10.1007/s11367-016-1087-8.
Wolfrom, L., and M. Yokoi-Arai, M. 2015. “Financial Instruments for Managing Disaster Risks Related to Climate Change.” OECD Journal: Financial Market Trends 2015(1). Available from doi: 10.1787/fmt-2015-5jrqdkpxk5d5.
Zah, R., M. Spielmann, P. Teuscher, M. Stoll, and N. Fischer. 2015. Research Project-Indirect GHG Emissions Calculation in Switzerland: Executive Summary of the Final Report. Quantis and BSD Consulting on behalf of the Swiss Federal Office for the Environment (FOEN).
Biography
Mette Emsholm Kjær is an ESG Analyst at responsAbility Investments AG in Switzerland. Here, she performs ESG research on and assessments of companies and projects in developing countries concerning renewable energy, finance, and agriculture. She holds a master’s degree in Climate Change from the University of Copenhagen, where she conducted her master’s thesis in the fintech company Carbon Delta, Switzerland. From the European Institute of Innovation and Technology, Mette Emsholm Kjær earned a master’s program certification, Climate-KIC. Her experience also includes environmental management and data analysis for the Danish Ministry of Energy, Climate, and Utilities. She is based in Zürich.