
J. Ritchie
Institute for Resources, Environment and Sustainability, University of British Columbia
H. Dowlatabadi, PhD
Canada Research Chair in Applied Mathematics and Global Change, University of British Columbia; University Fellow, Resources for the Future
Abstract
Fossil fuel divestment campaigns have focused attention on the holdings of oil, gas, and coal companies in the portfolios of university endowments. In this paper, North American universities with endowments larger than USD 1 billion are characterized by how they may handle a divestment commitment based on their priorities of income (Grasshoppers) or growth (Ants). The divestment tradeoff is most challenging for institutions deeply reliant on dividend returns from their endowments, the Grasshoppers in our story. A characteristic Grasshopper institution is analyzed for the benefits it receives from holding investments in fossil fuel companies, including its receipt of dividend income and price returns. Three strategies are considered for how this institution could reduce its holdings in fossil fuel investments from 2010 through 2014 while balancing its operating budget: (a) by investing in other sectors with higher income potential and less volatility, (b) by investing in fixed-income green bonds, and (c) by reducing operating costs on campus (for example, through energy and water efficiencies). In each case, selling off oil and gas holdings during this period provided a comparable or surplus benefit. However, this analysis takes place over a relatively bearish period for energy equities. In the case of re-investing in campus efficiency, these benefits would be difficult to realize in the context of university governance and budgeting processes.
What Divesting May Yield: Revisiting “The Grasshopper and the Ant” in the Context of University Endowments
Fossil fuel divestment campaigns have challenged educational institutions to sell their investments in oil, gas, and coal companies. Their goal is to generate momentum for political action on climate change by stigmatizing fossil fuel companies in the eyes of the public. One way to achieve such public awareness is by scrutinizing the investment returns received by individuals and institutions from these industries with high greenhouse gas emissions. Universities, however, have been reluctant to divest, emphasizing the importance of returns from endowments to their operating budgets.
Both sides have valid arguments. Any harm to the endowment’s returns would have an impact on the ability of the institution to achieve its educational mission. Universities worry that excluding fossil energy industries from the endowment will harm overall returns. For example, in a 2013 speech, Harvard University President Drew Faust[1] said “Despite some assertions to the contrary, logic and experience indicate that barring investments in a major, integral sector of the global economy would . . . come at a substantial economic cost.” Yet, are institutions ignoring significant financial risks by relying on investment income from companies that will dramatically need to alter their operating strategy to curtail GHG emissions?[2]
One can argue that moral leadership is part of a university’s core mission and that this should enter the calculus of any “cost” associated with divestment. However, the ability of different institutions to pay the price of such leadership depends on how much they rely on income from their endowments to balance their operational budgets. Some institutions will be more capable of leading the way on divestment.
Opinions on the financial impacts to institutions from divestment are flourishing.[3] Many comparisons have been made between the performance of unrestricted and divested equity indices. However, there has been limited discussion about the real contribution of fossil fuel stocks to model portfolios based on the asset allocation of an actual university endowment. Holding stock in oil, gas, and coal companies has been attractive primarily for sustained dividend yields alongside growth potential[4], which is why so many people are looking into oil investments as a way of making money.
As with any portfolio, endowments are managed to generate a balance between assured short-term income and potential medium- to long-term growth. The size of the endowment and the budgetary requirements of each university dictate how its endowment is managed.
This distinction has critical implications for whether an institution may choose to divest and how its commitment may be implemented. Furthermore, there is the societal question of whether these divested funds could be used to support companies pursuing the development of a low-carbon economy, thus reducing emissions in line with the broader motivations driving these campaigns.[5]
In this paper, the question of divesting from fossil fuels is framed around the reliance of university endowments on returns from investments. We then analyze our own university’s endowment and estimate its income from holdings in the fossil energy sector over the last eight years. Then, we suggest ways to substitute for this income by (a) changing the sector allocation of the endowment’s equity investments, (b) modifying the asset mix by investing in fixed-income securities that are focused on mitigating climate change, such as climate or green bonds, and (c) exploring opportunities to reduce costs on campus by investments in efficiency. Although the efficacy of these strategies will vary based on specific context, opportunities may exist for most universities to reinvest on campus by reducing operating costs while enabling emission reductions.
Income versus Growth Endowments: Scale Driven Approaches to Investing and Divesting
North American universities have access to endowments that range from a few million to tens of billions. The operating budgets of these universities will rely to varying degrees on returns from their endowment. This allows for categorizing endpoints of growth and income on the divestment commitment spectrum. Institutions that hold a small endowment relative to their operating budget will tend to focus on investing for income-and hereafter are called Grasshoppers. Institutions with endowments considerably larger than their annual operating budget can opt for longer-term growth-and hereafter are called Ants. In the context of divestment, Ants are capable of investing with a reduced reliance on the immediate yield provided by oil and gas or fossil-intensive utility stocks.
The ratio of endowment-to-budget requirements will determine which universities are Ants and which are Grasshoppers. The vast majority of public universities have rising enrollments and falling public subsidies per enrolled student. They have to balance the challenge of tight budgets, competition for top students and faculty, and the demands of various stakeholder groups. These Grasshopper institutions depend on income from their endowment holdings to balance their books. In such operating contexts, a commitment to divest will be difficult unless it is combined with strategies that replace lost income and/or reduces operating budgets.
Ant institutions have more ability to trade income for growth potential in the future. With an endowment much larger than their immediate needs, Ants can have the financial resources and patience to generate both income and investment with long-term growth in mind. These universities can manage a larger portion of their endowment at elevated levels of risk, and more easily commit to divesting a portion of their funds. Ants have the highest potential among universities to develop the market for fossil free and low-carbon financial offerings.
Growth companies offer securities with low or nonexistent dividends while they develop new processes or technologies. Their value proposition often lies in offering more economic output per unit of mobilized primary resources. In some cases, their products are consistent with a low-carbon economy, though they use fossil fuels and raw materials. Companies manufacturing solar cells and wind turbines are typical of growth investments, currently delivering upside potential but few dividends along the way.[6]
The National Association of College and University Business Officers (NACUBO) reported in 2014 that 92 North American[7] universities had endowments of at least USD 1 billion in assets.[8] The aggregate value of these endowments totaled $385 billion, and their distributions varied (Figure 1). Twelve of these endowments account for $200 billion.[9]
Figure 1: University Endowment Distribution by Scale
Income versus Growth Endowments-examples of universities at each point along this curve are provided.
Endowment size is not an indicator of whether the institution has chosen to depend on its endowment income to ![]() support the scope and scale of its services (as highlighted in Figure 2). In reality, all institutions are a hybrid of Ants and Grasshoppers. They hold mental accounts in which some portion of their portfolio is reserved to ensure survival and the remainder is invested in the hope of riches. Annual operating budgets ranged from 7% to 167% of their endowment’s market value for the universities considered.
support the scope and scale of its services (as highlighted in Figure 2). In reality, all institutions are a hybrid of Ants and Grasshoppers. They hold mental accounts in which some portion of their portfolio is reserved to ensure survival and the remainder is invested in the hope of riches. Annual operating budgets ranged from 7% to 167% of their endowment’s market value for the universities considered.
Figure 2: Endowment-to-Budget Ratio for 28 Universities
While having the largest investment portfolio, Harvard derives 35% of its operating income from endowment returns. Although the targeted payout ratio from Harvard’s endowment is within a reasonable range of 5% to 5.5%, the sheer size of the endowment will generate large components of revenue. Thus, Harvard is more appropriately a hybrid income and growth endowment. Conversely, Swarthmore College has a $1.88 billion endowment with an annual operating budget of $128 million. Despite a relatively small endowment, it is likely more capable of committing to divestment[10].
Endowment Case Study: How Much Did Fossil Fuel Companies Contribute to Income and Growth?
Our home institution, The University of British Columbia (UBC), has an endowment of USD 1 billion and an annual operating budget of USD 1.2 billion.[11] This institution is a prime example of one with an endowment managed to maximize income.
Dividend income was estimated for our university’s equity holdings in the 10 major sectors over eight years from 2007 to 2014 (Figures 3 and 4).[12] Data on specific holdings were gathered from the public statements on the Campus’s Treasury website, as reported in 2013.[13] In a recent paper, we analyzed the UBC endowment for its exposure to carbon emissions.[14] Over half of the endowment’s market value is in public equity holdings in eight pooled investment funds.
Endowment holdings were clustered into ten sector indices: (1) basic materials, (2) communication services, (3) consumer discretionary, (4) consumer staples,[15] (5) oil and gas, (6) financial services, (7) healthcare, (8) industrials, (9) technology, and (10) utilities. The proportion of the endowment’s market value in oil and gas holdings ranged from 11.7% to 16.3% during the period examined. Relationships between dividend yield and average sector share prices highlight the volatile cycles for equities in each sector (Figure 4).
Figure 3: Dividend Yield by Sector from 2007 to 2014
Figure 4: Volatility of Growth and Yield from 2007 to 2014
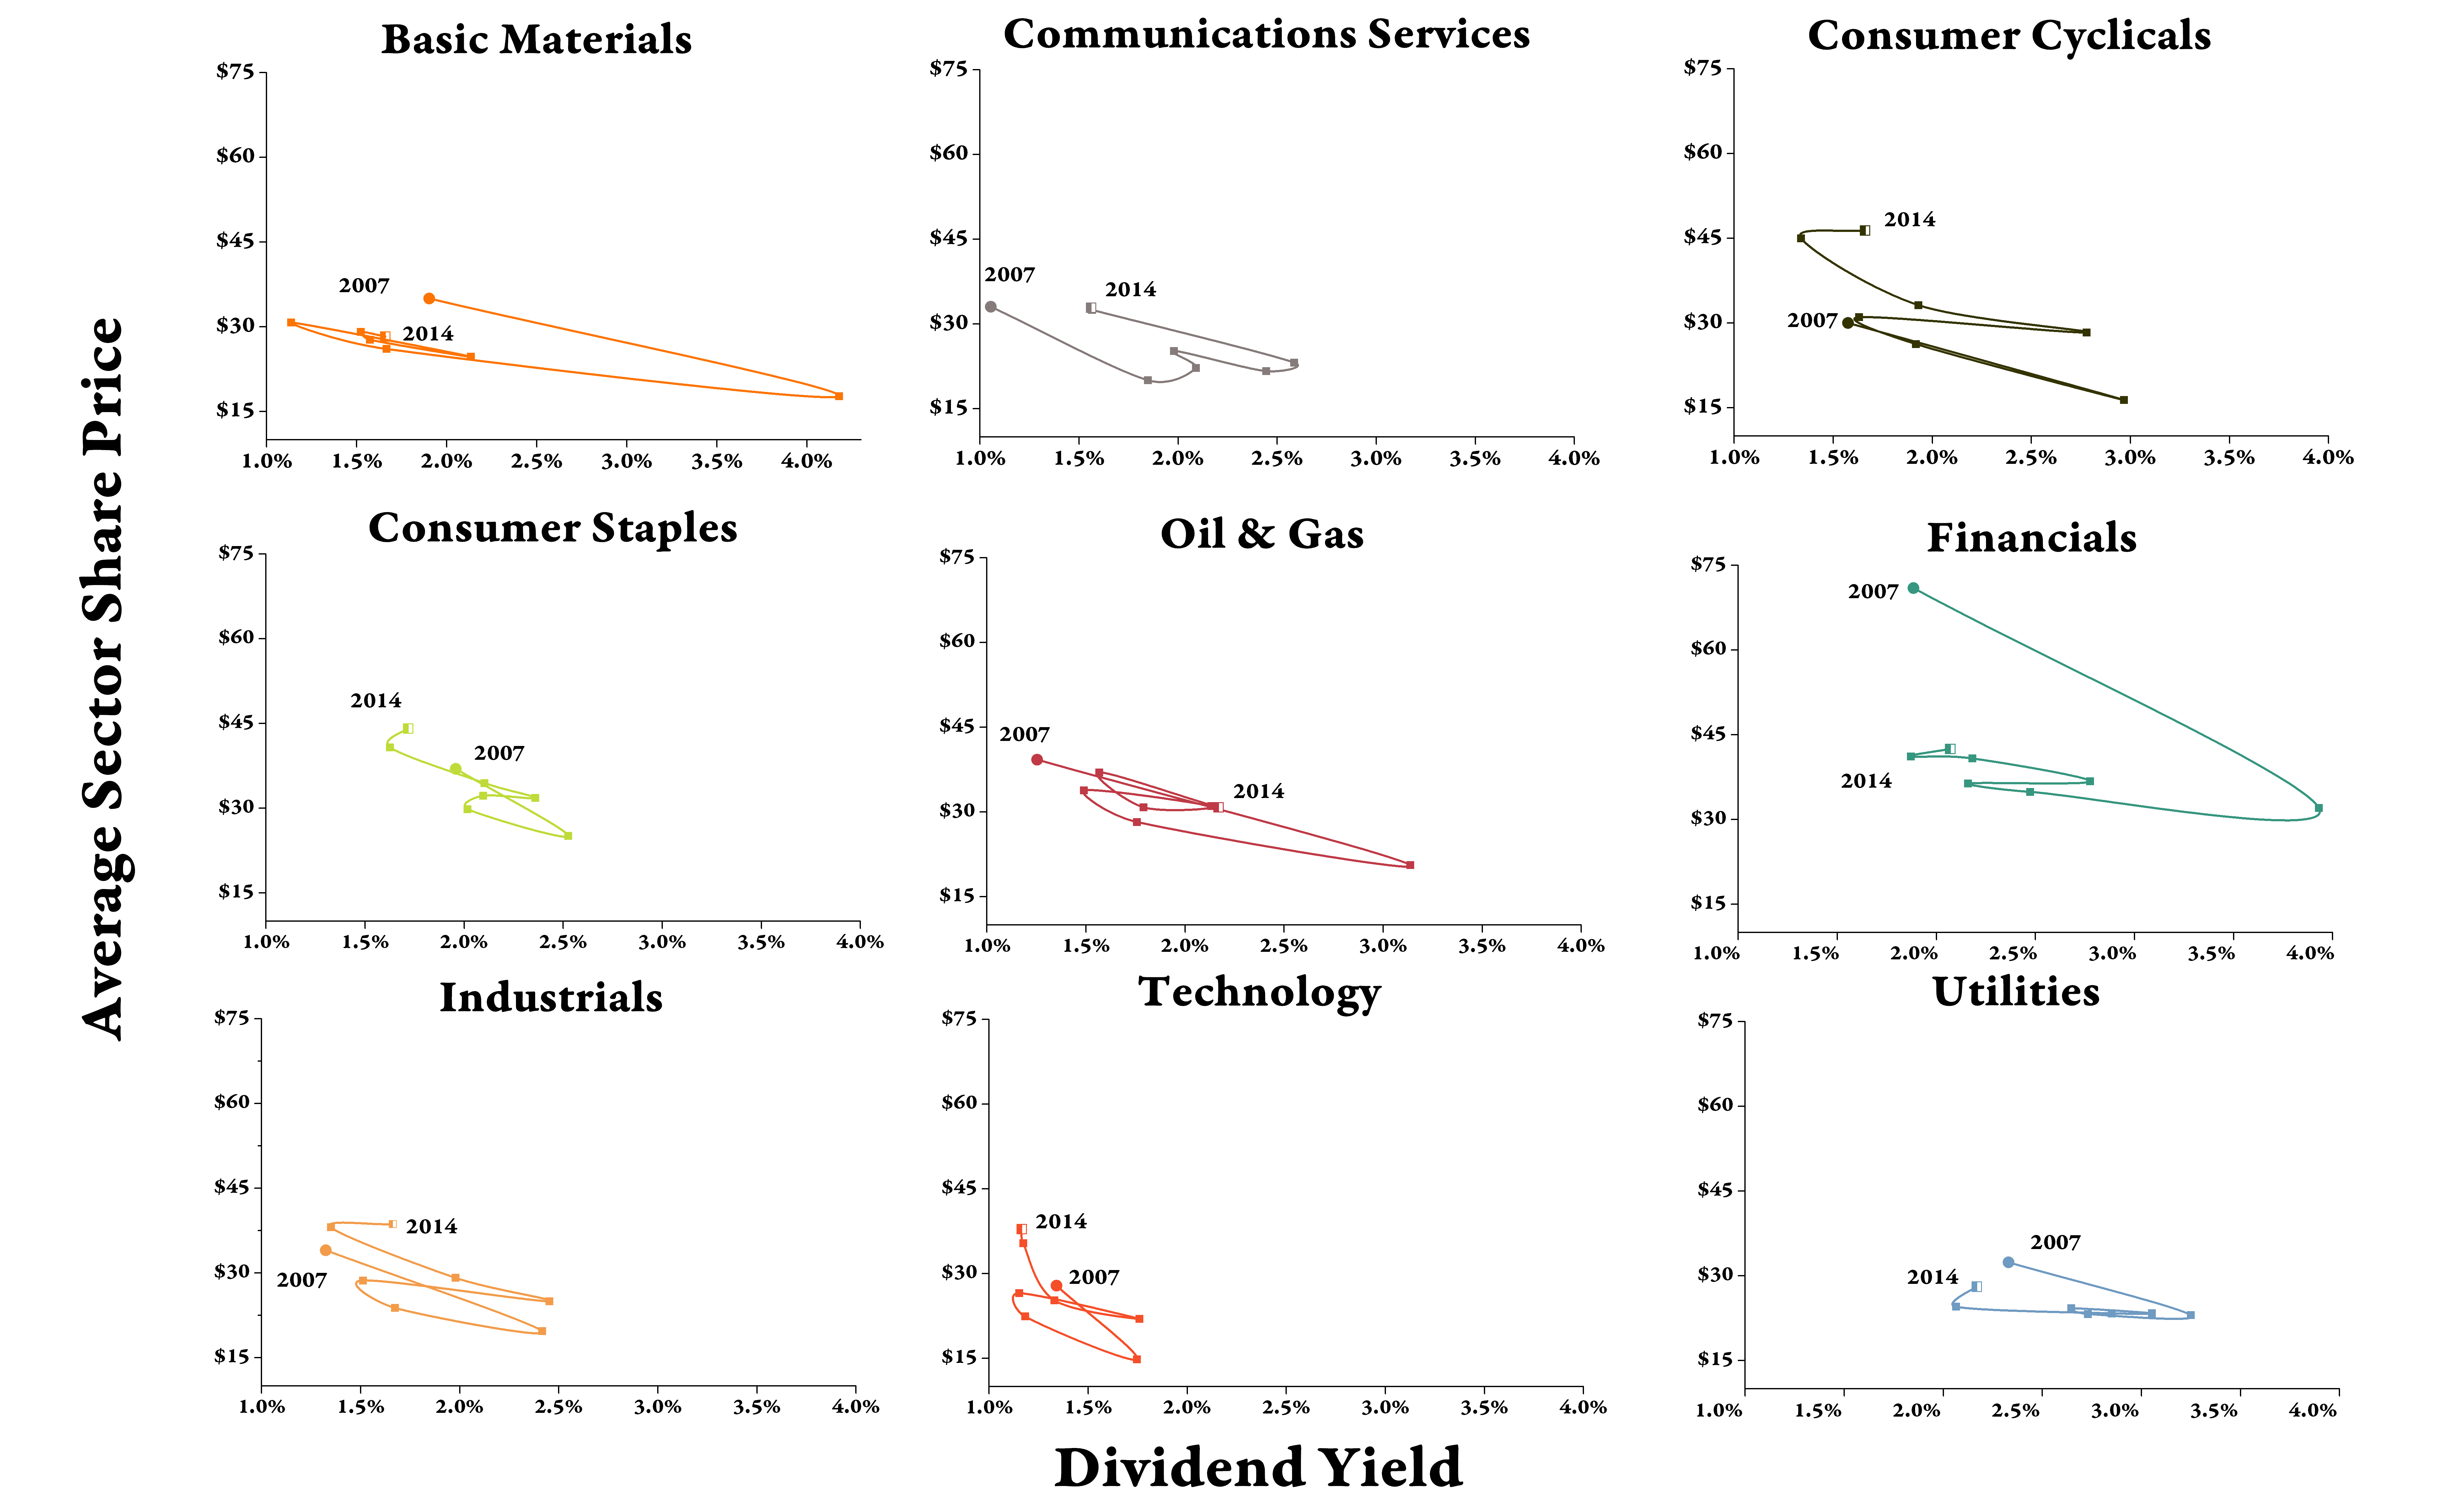
Note: In Figure 4, the initial year of 2007 is marked with a circle and the ending year of 2014 is marked with an open square; the healthcare sector has been excluded from this 3×3 matrix, since it is the sector generating the least amount of dividend income.
The income generated for the endowment by holdings in each of these sectors was estimated; that is, the dividends the endowment would have received in real terms,[16],[17] before management fees, from each of these sectors by assuming a static holding of shares in each sector over the eight-year period. In total, over the eight years these investments yielded $75 million of income.
Five sectors generated roughly 80% of the cumulative dividend income for this endowment: (1) financial services ($24.7 million), (2) oil and gas ($12 million), (3) basic materials ($8.4 million), (4) industrials ($7 million), and (5) consumer staples ($6.9 million).
The endowment’s managers are already optimizing for income. Sectors with the highest dividend yield performance within this time frame constitute the highest proportion of the endowment’s market value: financial services, oil and gas, industrials, and consumer staples. If growth potential was the goal, we could expect that healthcare, technology, communication services, and consumer discretionary would occupy a larger proportion of the endowment’s market value.
Our university’s oil and gas equity holdings generated an average of $1.5 million each year. Those holdings were one of two sectors also showing above-average dividend yield and risk-adjusted income as well as income growth. Only investments in consumer discretionary companies had similar performance.
Many investments in the utility sector are associated with high levels of GHGs from the combustion of coal and gas. We estimate that approximately 80% of utility-sector dividend income is related to fossil fuels, slightly more than the amount of U.S. electricity generation from fossil fuels. Thus, the total cumulative fossil-fuel-related income generated for the endowment by these public equity investments was approximately $2 million per year.
The risk-adjusted income over these eight years was calculated by dividing the average dividend income per sector by the standard deviation: where Rdividend is the risk-adjusted dividend returns, calculated for each sector, Dsectoraverage is the sector average dividend income, and ?sector is the sample-corrected standard deviation of the dividend income. The results of these calculations can be seen alongside the average proportion of the endowment’s public equity market value in each of these sectors (Figure 5).
Figure 5: Endowment Risk-Adjusted Income by Sector
Ranked in order of risk-adjusted dividend income (Rdividend)
| Sector | Avg. Market Value(% of UBC endowment) | Average Dividend Income† (thousands USD) | ?sector | Rdividend | Dividend Growth 8 yr CAGR |
| Consumer Staples | 8.8% | $860 | $76,407 | $11.28 | –2% |
| Utilities | 3.4% | $620 | $60,977 | $10.20 | –2% |
| Consumer Discretionary | 9.3% | $700 | $81,495 | $8.55 | 2% |
| Industrials | 12.7% | $880 | $104,170 | $8.41 | 1% |
| Oil and Gas | 14.7% | $1,490 | $194,185 | $7.69 | 1% |
| Communication Services | 3.6% | $430 | $57,240 | $7.43 | 3% |
| Financial Services | 28.9% | $3,090 | $643,388 | $4.80 | –5% |
| Technology | 6.0% | $240 | $53,013 | $4.44 | 4% |
| Basic Materials | 10.0% | $1,050 | $329,586 | $3.17 | –7% |
| Healthcare | 2.7% | $80 | $28,297 | $2.80 | 0% |
†Average annual dividend income over eight years.
Risk-adjusted incomes by sector fall into three categories: (1) well above average with negative growth (consumer staples and utilities); (2) above average with moderate growth (consumer discretionary, industrials, communication services and oil and gas); and (3) below average. Although the financial services sector constitutes the largest portion of UBC’s endowment’s value, it experienced a 5% decline in its real dividend income over the last eight years.
Dividend income is only one component of the total returns considered by the endowment manager. However, from the perspective of university operations, dividends will take priority. Although income could also be gained through fixed-income investments and other asset classes, public equities are attractive because of the potential for dividend growth and returns from capital appreciation in share valuation.
Financial markets are highly stochastic and subject to many noneconomic factors. In the absence of omniscience, it is not possible to time the market buying at the nadir and selling at the zenith of a stock’s valuation. Hence, the value of portfolios and their returns vary according to the time-period considered. This is illustrated by showing the Compound Annual Growth Rate (CAGR) for UBC’s endowment in these 10 sectors as measured for different time frames (Figure 6).
Figure 6: Endowment Market Value Growth Per Sector Over 6, 7, and 8 Years
Ranked in order of 6-year compound annual growth rate
| Sector | CAGR: 6 Years(2008–2013) | CAGR: 7 years (2008–2014) | CAGR: 8 Years (2007–2014) |
| Consumer Discretionary | 17.37% | 15.76% | 4.64% |
| Technology | 14.86% | 13.75% | 3.14% |
| Healthcare | 13.11% | 13.67% | 5.29% |
| Industrials | 11.96% | 11.16% | 2.19% |
| Oil and Gas | 8.54% | 4.57% | –3.70% |
| Basic Materials | 8.09% | 5.41% | –4.86% |
| Consumer Staples | 7.23% | 8.01% | 2.06% |
| Financial Services | 5.93% | 5.41% | –4.95% |
| Communication Services | 5.51% | 5.55% | –0.77% |
| Utilities | 3.28% | 4.64% | –0.74% |
| Average | 9.59% | 8.79% | 0.23% |
The perceived performance of these sectors will vary based on the period of time considered. Events such as the market crash that began in late 2007 and the 2014 declines in commodity prices influence any analysis that is shorter than the return period of market gyrations. Each of these sectors has experienced various stochastic and secular trends in the last decade. Regardless, these results suggest that holdings in oil and gas and utilities performed below average through all time frames considered. Yet, even if 4–9% returns were below the ten-sector average, they would provide a notable contribution to the university’s endowment, especially when dividends are sustained at a high level. Holdings in consumer discretionary, technology, healthcare, and industrial sectors performed above average regardless of the time frame, demonstrating that they are largely “growth” sectors. However, each sector will have a distribution of mature income companies and young companies with potential.
In the following section, we explore three potential alternatives that could be considered to compensate for income loss due to implementing divestment from fossil fuel holdings.
Exploring Options for Income Substitution
Whenever income is placed at risk or novel investment strategies are considered, such as screening an entire sector, behavioral factors will unavoidably be at play. Investors selling their oil and gas assets will likely demand a higher sale price to offset the present value of expected income, or seek an alternative that would not only meet but exceed the income of the previous choice.[18]
Because investors tend to hold different mental accounts for portions of their portfolio, segments of their portfolio will represent a varying range of goals and aspirations. It is possible that, especially for Canadian investors, oil and gas investments represent a hybrid portion of the portfolio that can achieve aims of safety through income and the aspiration of higher prospective returns.[19]
In order to divest without impacting operations and growth aspirations, the Trustees of our University would be seeking more than $2 million in annual income or operational savings to cover the risk-premium of divesting from the $1.5 million of annual income provided by oil and gas. Furthermore, the campus’s fossil fuel divestment campaign is requesting that the university divest over five years. Thus, we have used back-casting to explore three options that could have been put into place five years ago as illustrative examples for the divestment decision in our future. Let us also note that we do not believe that past market performance is in any way indicative of future trends.[20]
Option 1: Modifying the Sector Distribution of Equities
In analyzing the contribution of various sectors to the income and growth of our university’s endowment, we noted that investments in consumer staples stood out for their steady growth and high risk-adjusted income. It is likely that an income-seeking university could have traded many of its oil and gas stocks for companies representative of strong performers in consumer staples.
We considered a case in which our university started trading its oil and gas holdings for consumer staples at a steady amount in 2010, zeroing out fossil fuel investments by the close of 2014 (Figure 7)At the end of this five-year divestment strategy, there would have been little impact on income from dividend yield and a notably higher market value in the endowment, an average net benefit over each of the five years of $5.2 million,[21] well above our $2 million per year threshold.
Figure 7: Oil and Gas Stocks Traded for Less Volatile Slow Growth and
High-Yield Sector
(all values in thousands USD)
Endowment Actual Case
Using performance data modeled from university endowment holdings
| Allocation | Market Value | 2010 | 2011 | 2012 | 2013 | 2014 | Price CAGR | Cumulative Income |
| 8.34% | Consumer Staples | 44,200 | 42,500 | 46,000 | 52,400 | 59,100 | 5.98% | 4,760 |
| 16.17% | Oil and Gas | 85,800 | 77,200 | 74,800 | 86,100 | 71,900 | -3.44% | 7,170 |
| Total | 130,000 | 119,000 | 120,000 | 138,000 | 131,000 | 0.17% | 11,900 | |
Modeled Case
Oil and gas market value to obtain zero balance by end of 2014
| Market Value | 2010 | 2011 | 2012 | 2013 | 2014 | Cumulative Income |
| Consumer Staples | 61,400 | 74,400 | 95,300 | 126,000 | 156,000 | 9,780 |
| Oil and Gas | 68,600 | 46,300 | 30,100 | 17,300 | 0 | 2,820 |
| Total Market Value | 130,000 | 121,000 | 125,000 | 143,000 | 156,000 | 12,600 |
| Market Value/Income Net Benefit (+/-) | – | 1,020 | 4,620 | 4,850 | 25,500 | 700 |
Note: In this case, the endowment’s oil and gas holdings are drawn down over five years to reach zero in 2014. The sell rate was 20%, 25%, 33%, 50%, and 100%, respectively, in order to achieve a balanced quantity of market value sold each year ($14.5 M +/- 1.4 M). At the end of each year, (a) the previous year’s sector performance was factored in (b) the respective sell-off rate was applied to the remaining oil and gas holdings, and then (c) this amount was transferred to holdings in consumer staples.
Although it is much easier to develop such an analysis in hindsight, it seems unlikely (in early 2015) that volatility in the oil and gas sector has ended; the upside potential is likely to be determined by whether deflationary trends and sentiments in developed and emerging markets are secular or cyclical. Given the consistency of the income and growth performance of the aggregate consumer staples sectors, it seems that this pathway for divesting could have provided many universities with better income and growth potential for their equity portfolio.
If we extend our comparison between these two sectors further back in time, we find that removing exposure to oil and gas companies doesn’t provide favorable results for the endowment. Over seven years (2000–2006), oil and gas stocks outperformed consumer staples by an average of 7.5% per year. A similar divestment scenario run from 2002 to 2006 would have resulted in net unrealized gains averaging $4.2 million each year.
A similar set of results could be achieved for income substitution by selecting specific utility companies. In the context of fossil fuel divestment, additional effort would be needed to screen fossil-intensive utilities while targeting the companies that are leading the way in expanding the renewable portion of their generation portfolio.
Income Substitution Option 2: Green Bonds
Although fixed-income investments will offer different characteristics than equities, they are currently the strongest pathways for allowing institutional funds to leave fossil fuel companies while also providing financial resources for developing a low-carbon economy.
For universities that seek to invest directly in the infrastructure and technologies that can aid in climate change mitigation and adaptation, there are more options available in fixed income than in equities. Adopting a stronger position in climate bonds or green bonds would require changing the risk profile of the endowment portfolio and would also remove the potential for dividend growth and much of the price returns offered by equities. A number of pension funds and universities are increasing their exposure to infrastructure, finding a liquidity premium in their search for yield.[22] Our campus is following this path.
In 2013, our university adopted new policies for its target asset mix that seek to increase investments in infrastructure by 8.5% while drawing down investments in equities from 61% to 45% of the portfolio. Achieving this policy mix would give a university the opportunity to draw down investments in fossil fuel companies while also adopting a policy that invests in infrastructure to support a low-carbon future.[23]
The green bond market has grown from USD 1 billion when the first World Bank Green Bond was issued in 2008 to more than $40 billion issued in 2014 and a projected $100 billion in issuances in 2015.[24] Now there are over $500 billion in climate-themed bonds available that are investing in transport ($358.4 billion), energy ($74.7 billion) and finance ($50.1 billion).[25] In the domain of energy, utilities like EDF, Iberdrola, and GDF Suez are issuing green bonds to finance renewable energy projects, though utilities are only beginning to pick up on this possibility. In transportation, China Railways is the largest single issuer of low-carbon transport bonds to support the development of rail projects.
The World Bank has been a key player in developing the green bond market, issuing slightly more than 6% of the green bonds listed on the Barclays green bond index. Through early 2015, the World Bank had issued USD 8 billion in 80 offerings,[26] with an average coupon of 3.3% and average maturity of 7 years. The Calvert Green Bond Fund aims to invest 80% of its assets in green bonds with an average coupon of 3.26% and average duration of 4.8 years.[27],[28]
With this context, we provide a scenario in which our campus began drawing down its oil and gas investments five years ago, transferring the balance each year to green bonds that yield 2.40% each year (Figure 8).[29] In this case, we assume no appreciation in the value of the bond holdings.
Had this option been chosen, it would have generated $1.4 million in additional income and would have avoided $7.2 million in losses, a total surplus of $8.6 million over the base case. This provides an average of $1.72 million in benefits each year, slightly less than our target of $2 million each year but more than the annual average fossil fuel income. In this scenario, holding on to the potential upside returns of fossil fuel companies would have been a net cost to the university.
Figure 8: Endowment Investments in Green Bonds
(all values in thousands USD)
Modeled Case
Equal market value in green bonds and oil and gas stock
| Market Value | 2010 | 2011 | 2012 | 2013 | 2014 | bond + oil and gasCumulative Income |
| Oil and GasMarket Value | 68,600 | 46,300 | 30,100 | 17,300 | 0 | |
| Green BondIncome | 410 | 780 | 1,140 | 1,550 | 1,900 | 5,790 |
| Oil and GasDividend Income | 1,020 | 990 | 536 | 270 | 0 | 2,820 |
| Total Income | 1,430 | 1,770 | 1,680 | 1,820 | 1,900 | 8,600 |
| Net Benefit (+/-) | 160 | 124 | 338 | 476 | 339 | 1,430 |
Income Substitution Option 3: On-Campus Reductions in Energy and
Resource Use
In the first two scenarios, we proposed alternative investments to fossil fuel companies for our campus endowment that would have resulted in more income and a higher market value for its holdings. In this third scenario, we consider the potential for reducing costs on campus by reducing the use of energy and resources with investments in efficiency that curtail university utility operating expenditures.
Since our campus earns $2 million in income each year from its fossil fuel stock holdings, these revenues could be apportioned to a holding fund specifically earmarked for improving the resource efficiency of the campus, or the principal could be invested directly. A green revolving loan fund has been maintained at our campus since 2010 which currently aims for a 20% to 50% return on investment (ROI) on projects ranging from $10,000 to $200,000. Revolving loan funds and other approaches to energy efficiency have the potential to be a strong alternative to conventional approaches to endowment investing. Divestment campaigns have suggested green revolving loan funds as a way to invest funds that have been divested from fossil fuel companies.[30]
The Sustainable Endowments Institute (2013) studied 36 green revolving-loan funds across North America with a median return on investment of 28%.[31] We assume that the heavy investment in energy efficiency and carbon-reduction projects on our campus over the two decades have placed it below the minimum threshold for returns from energy efficiency projects. From 2001 to 2008, our university implemented a $39 million program to upgrade 288 academic buildings, assuming a 4.16% ROI. These projects were reported to yield guaranteed utility savings of at least CAD $2.6 million per year. In addition to a lower realizable return from efficiency investments, an additional unique characteristic of our campus is that we are subject to British Columbia’s carbon tax rate of $30/tonne plus a mandatory $25/tonne GHG offset fee for public institutions. Thus, the university has an effective carbon cost of $55/tonne and incurs on-going costs of approximately CAD $3 million annually due to campus GHG emissions of roughly 60 ktCO2e.
The campus utility budget for energy and water for 2014 is estimated at USD 18.9 million (2% of the total annual operating budget), including the carbon tax. Our campus has been able to reduce emissions at an average of 2% per year over the last five years, but expenditures on other utilities have increased at more than 4.7% per annum.
Next, we consider a scenario in which our campus sells off its oil and gas investments at a steady amount each year and uses those funds to invest in energy and resource efficiency projects that yield a 3% ROI, while reducing greenhouse gases at 5% per year (Figure 9).[32] Because the campus would be investing in capital infrastructure over several decades, we estimate that this infrastructure depreciates at the Canada Revenue Agency Class 1 Rate of 4% each year.
Figure 9: Endowment Trades Oil and Gas Holdings for Campus Energy Efficiency
(dollar values in thousands USD)
Endowment and Campus Actual Case
Using performance data modeled from university endowment holdings
| Market Value | 2010 | 2011 | 2012 | 2013 | 2014 | CAGR | Cumulative Income, GHGs or Cost Over 5 Years |
| Oil and GasMarket Value | 85,800 | 77,200 | 74,800 | 86,100 | 71,900 | -3.44% | $ 7,170 in income |
| Campus GHG EmissionstCO2e | 61,000 | 68,000 | 65,000 | 56,000 | 55,000* | -2.05% | 305,000 tCO2e |
| Annual Utility Spendincluding USD $47/tonne | (15,900) | (16,000) | (17,600) | (17,800) | (18,900) | 3.60% | $ (86,300) |
*estimate
Modeled Case
Oil and gas holdings sold over five years and invested in 3% average annual ROI energy efficiency projects w/ 5% annual GHG emission reduction
| Market Value | 2010 | 2011 | 2012 | 2013 | 2014 | CAGR | Cumulative Income, GHGs, Efficiency Investment or Cost Over 5 Years |
| Oil and GasMarket Value | 68,600 | 46,300 | 30,100 | 17,300 | 0 | -100% | $ 2,820 in income |
| Campus GHG EmissionstCO2e | 57,950 | 61,370 | 62,124 | 54,180 | 46,408 | -4.3% | 282,000 tCO2e |
| Annual Utility SpendIncluding USD $47/tonne | (15,200) | (15,000) | (14,200) | (12,360) | (10,100) | -8% | $ (66,700) |
| Annual Investment in Efficiency | 17,200 | 15,400 | 14,800 | 17,300 | 14,500 | -3% | $ 79,200 |
| Capital Infrastructure Depreciation Realized | 0 | (686) | (1,300) | (1,900) | (2,600) | -39% | $ (6,500) |
| Total Net Benefit: Utility and Carbon Tax Savings + Oil and Gas Income +Value of Capital Infrastructure Over Base Case – Capital Depreciation | $ 14,300 | ||||||
Investing $79 million at an annual 3% ROI in energy efficiency over five years results in $18.4 million of avoided utility costs over the base case, and $1 million in carbon tax savings. When the market value of fossil fuel holdings and their dividend yield is considered, the total annual net benefit over the base case is approximately $14.3 million or $2.9 million each year. These savings exceed the estimated value of the fossil fuel income over this period by 45%.
By following this option, the campus would have lower GHG emissions and utility bills, thus reducing the budgetary pressure to generate income from fossil fuel holdings. Such a scenario is favorable for institutions with high-energy costs and inefficient infrastructures. Smaller and more efficient campuses are less likely to realize the same net benefits from investing so heavily in on-campus energy efficiency.
However, we haven’t considered the potential rebound effects of increased energy use on our campus or the difficulties in realizing these savings in a meaningful way. Institutional budgets regularly face discrepancies between departmental, research, operational, and capital funds: savings in one department are rarely passed on to another. The incentives to pursue a scenario like this are often diffuse in a complex governance hierarchy.[33]
Since we have considered only the past, projecting similar scenarios into the future should be weighed against the potential considerations of utility cost increases, the social cost of carbon, discount rates, and oil and gas market dynamics. Perhaps universities could make guaranteed savings possible in this method by offering green bonds to other institutions: the Ant could provide a resource to the Grasshopper.
Summary
In this paper, we have characterized North American universities for their ability to divest in the context of their varying investment objectives. These approaches have been framed by the relationship between camps endowments and budgets, leading some universities to invest as Grasshoppers and others as Ants. We have suggested that committing to divestment will be an easier decision for universities that rely less on their endowment’s dividend yield to immediately balance their operational budget (Ants). Universities with endowments that are not significantly larger than their annual operating budget will favor investment in mature industries that provide high yields and moderate growth potential. Persuading Ants to divest should be a more straightforward task. Their endowments can be patient with returns. Persuading Grasshoppers to divest will require their trustees to be convinced that the alternatives do not impinge on their future growth and do not subtract from the discretionary budgets.[34]
In considering how divestment could have an impact on universities, we were able to find three attractive alternatives to holding fossil fuel stocks over the last five years. Shifting our campus endowment’s equity sector allocation, investing in green bonds, or investing in campus energy efficiency were all compelling substitutions. While our university likely obtains $2 million per year in dividends from holding fossil fuel stocks, these scenarios indicate that replacing this income isn’t an insurmountable challenge. However, we assumed omniscience about dividend returns and equity values over a five-year time horizon. It is useful to note that the period in question begins immediately after the deepest economic recession in 80 years, followed by a double-dip recovery and a slowdown of the world’s second- and third-largest economies (EU and China), and ending with a bearish period for oil and gas.[35] None of these factors would have been predictable with any degree of detailed confidence in 2009 or during the five years covered in our scenarios. All of these factors served to depress oil and gas equity values. Today, in early 2015, we are exactly at a point when portfolio managers would most resist divestment because they hold very high expectations of an upside potential from rising oil and gas equity prices due to an energy commodities market in contango. So, while all three alternatives considered here have painted a rosy picture, they framed divestment positively because the world economy has behaved in unexpected ways. And the world is unlikely to behave in wholly expectable ways during the years ahead.
Epilogue
This paper is about alternatives that universities may consider in response to divestment campaigns. However, we have not considered the deliberate choices universities make in designing the scope and scale of their services. As discussed earlier, some consider moral leadership an inalienable part of the university mission. It is also widely acknowledged that research and training at universities fuel the engine of economic development. A carefully designed strategy of divestment can signal strong moral leadership as well as deliver targeted R&D and training that will hasten transition to a sustainable economy. Such choices are not a matter of comparative dividends, but of true leadership by our academic institutions.
Acknowledgements
We are grateful to Harsh Arora for help with gathering historical data on equity performance. This work was made possible through support from the Pacific Institute for Climate Solutions (Transition to a low GHG economy, 36170–50280); the Carnegie Mellon (CMU) Climate and Energy Decision Making Center (CEDM) under a subcontract from the US National Science Foundation (SES–0949710); and the Social Sciences and Humanities Research Council.
References
Ang, Andrew, Dimitris Papanikolaou, and Mark Westerfield. Portfolio Choice with Illiquid Assets. NBER Working Paper Series, September 12, 2013. doi:10.3386/w19436.
Barclays. 2015. Barclays MSCI Green Bond Index. Barclays. January. Available from http://www.msci.com/resources/factsheets/Barclays_MSCI_Green_Bond_Index.pdf.
Nathaniel Bullard. 2014. Fossil Fuel Divestment: a $5 Trillion Challenge. Bloomberg New Energy Finance White Paper. August 25. Available from http://about.bnef.com/white-papers/fossil-fuel-divestment-5-trillion-challenge/.
Bureau of Labor Statistics. 2015. CPI Detailed Report-Data for January 2015. Edited by Malik Crawford, Jonathan Church, and Bradley Akin. bls.gov.
Cleveland, Cutler, and Richard Reibstein. 2015. “The Path to Fossil Fuel Divestment for Universities: Climate Responsible Investment.” February 12. Available from http://energyincontext.com/wp-content/uploads/2015/02/University-Divestment-Fossil-Fuels-Cleveland_Reibstein_02_13_15.pdf.
Climate Bonds Initiative. 2014. Bonds and Climate Change. climatebonds.net.
Faust, Drew. 2013. “Fossil Fuel Divestment Statement.” harvard.edu. October. Available from http://www.harvard.edu/president/fossil-fuels.
Fischel, Daniel R. 2015. Fossil Fuel Divestment: a Costly and Ineffective Investment Strategy. divestmentfacts.com. February 13.
“Fossil Fuel Divestment Communications Guide.” gofossilfree.org. Accessed 2015. Available from https://s3.amazonaws.com/s3.350.org/images/Fossil_Free_Communications_Guide_1.pdf.
IMPAX Asset Management. 2013. Beyond Fossil Fuels: the Investment Case for Fossil Fuel Divestment. August 8. Available from http://www.impaxam.com/sites/default/files/20130704_impax_white_paper_fossil_fuel_divestment_final_0.pdf.
Kahneman, Daniel, and Amos Tversky. 1979. “Prospect Theory: an Analysis of Decision Under Risk.” Econometrica 47, no. 2 (March): 263. doi:10.2307/1914185.
Morgan Stanley Capital International. 2013. FAQ: Responding to the Call for Fossil-Fuel Free Portfolios. MSCI ESG Research Brief. December.
NACUBO. 2015. U.S. and Canadian Institutions Listed by Fiscal Year 2014 Endowment Market Value. nacubo.org. February.
Rengifo, Erick W., Rossen Trendafilov, and Emanuela Trifan. 2014. “Behavioral Portfolio Theory and Investment Management.” In Investor Behavior, edited by H. Kent Baker and Victor Ricciardi. Hoboken, NJ, USA: John Wiley & Sons, Inc., 2014. doi:10.1002/9781118813454.
Ritchie, Justin, and Hadi Dowlatabadi. 2015. Fossil Fuel Divestment: Reviewing Arguments, Implications and Policy Opportunities. Edited by Tom Pedersen. PICS White Paper Series. January 28.
Ritchie, Justin, and Hadi Dowlatabadi. 2014. “Understanding the Shadow Impacts of Investment and Divestment Decisions: Adapting Economic Input-Output Models to Calculate Biophysical Factors of Financial Returns.” Ecological Economics 106 (October): 132–40. doi:10.1016/j.ecolecon.2014.07.005.
Sustainable Endowments Institute. 2013. Greening the Bottom Line. February 2.
UBC Endowment Investment Holdings in PDF Format-Run Date October 23, 2012. University of British Columbia Treasury. University of British Columbia Treasury, December 2012.
University of British Columbia Investment Management Trust Inc. 2015. 2014 Annual Report. ubcimant.ca.
World Bank. “Green Bond Issuances to Date.” Accessed March 21, 2014. Available from http://treasury.worldbank.org/cmd/htm/GreenBondIssuancesToDate.html.
YCharts. 2015. “M:CGAFX – Quote and Charts for Calvert Green Bond A.” Ycharts.com. Available from http://ycharts.com/mutual_funds/M%3ACGAFX.
Biographies
Justin Ritchie is studying low-carbon financial strategies and the economics of energy transition as a PhD Candidate at The University of British Columbia’s Institute for Resources, Environment and Sustainability. He can be reached by email through [email protected].
Hadi Dowlatabadi sees the world in terms of interacting social, economic, and environmental systems. He studies how these systems create and respond to challenges over time. He has helped 44 students complete their PhDs on a wide range of topics. He designed LEAD, and co-founded Offsetters, GreenErg, and HydroRun Technologies. He is Canada Research Chair in Applied Mathematics and Global Change at UBC, Adjunct Professor in Engineering & Public Policy at Carnegie Mellon University, and University Fellow at Resources for the Future. He received his BSc and PhD in Physics from
[1]. Faust, “Fossil Fuel Divestment Statement.”
[2]. A portfolio adjusted for climate risk promises to shed light on this question by reflecting the certainty and dynamics of transition in the economy.
[3]. Morgan Stanley Capital International, FAQ: Responding to the Call for Fossil-Fuel Free Portfolios; Bullard, Fossil Fuel Divestment: a $5 Trillion Challenge; IMPAX Asset Management, Beyond Fossil Fuels: the Investment Case for Fossil Fuel Divestment; Fischel, Fossil Fuel Divestment: a Costly and Ineffective Investment Strategy; Cleveland and Reibstein, The Path to Fossil Fuel Divestment for Universities: Climate Responsible Investment.
[4]. Note that the growth potential is itself driven by the specter of a supply-demand imbalance for the resource.
[5]. As more institutional funds are committed to divest from fossil fuel companies, a broader pool of assets are created that could be used to hasten the transition to an economy based on sustainable practices and renewable energy.
[6]. Ritchie and Dowlatabadi, Fossil Fuel Divestment: Reviewing Arguments, Implications and Policy Opportunities.
[7]. NACUBO data includes universities in the United States and Canada.
[8]. NACUBO, U.S. and Canadian Institutions Listed by Fiscal Year 2014 Endowment Market Value.
[9]. Harvard, the University of Texas System, Yale, Stanford, Princeton, MIT, the Texas A&M system, Northwestern, University of Michigan, University of Pennsylvania, Columbia, and Notre Dame.
[10]. Because there is no universal standard for university budget reporting, there are unique factors on every campus in Figure 2, which we were unable to consider, but that will move them further toward the Ant or Grasshopper.
[11]. When considering Canadian university endowments and operating budgets, we use the foreign exchange rate at the end of 2014 for USD 1 = CAD 1.16.
[12]. The eight-year period of assessment was dictated by availability of data for dividend yield.
[13]. UBC Endowment Investment Holdings in PDF Format–Run Date October 23, 2012. Using this data, we assumed a static number of shares held in each sector over the time-series. Each sector index provided the dividend yield and price data.
[14]. Ritchie and Dowlatabadi, “Understanding the Shadow Impacts of Investment and Divestment Decisions: Adapting Economic Input–Output Models to Calculate Biophysical Factors of Financial Returns.”
[15]. The difference between consumer discretionary and consumer staples lies in partially distinguishing between companies that operate in consumer wants versus needs. In times of recession, consumer staples tend to do quite well, as demonstrated by the low deviation in the dividend of stocks from these sectors. Consumer staples are demonstrative of an income sector because of their low growth potential and high sustained dividends.
[16]. Bureau of Labor Statistics, CPI Detailed Report-Data for January 2015.
[17]. Adjusted for inflation using BLS CPI-U data, all values for income in constant 2007 dollars.
[18]. Kahneman and Tversky, “Prospect Theory: An Analysis of Decision Under Risk.”
[19]. Rengifo, Trendafilov, and Trifan, “Behavioral Portfolio Theory and Investment Management.”
[20]. Additionally, we want to emphasize that making a case for any of these scenarios in 2010 would have been a difficult task.
[21]. These results didn’t consider the costs of executing such trades, but it is likely that with these robust performance numbers, commissions could have been easily covered and the research that went into considering a drawdown in fossil fuel company investments would also be accounted for. Numbers may not add up due to rounding.
[22]. Andrew Ang, Dimitris Papanikolaou, and Mark Westerfield, NBER Working Paper Series, September 12, 2013.
[23]. University of British Columbia Investment Management Trust Inc., 2014 Annual Report. We would use their actual investments for our example here, but the reported progress toward achieving this policy mix has been limited.
[24]. Barclays, Barclays MSCI Green Bond Index.
[25]. Climate Bonds Initiative, Bonds and Climate Change.
[26]. World Bank, “Green Bond Issuances to Date.”
[27]. Though given the early stages of the green bond market, currently the largest holding of this fund is in U.S. Treasuries (about 25%).
[28]. YCharts, “M:CGAFX – Quote and Charts for Calvert Green Bond A.”
[29]. A yield of 2.40% accounts for deducting 0.9% for management fees from the average return of 3.3%.
[30]. gofossilfree.org, “Fossil Fuel Divestment Communications Guide.”
[31]. Sustainable Endowments Institute, Greening the Bottom Line.
[32]. The rates of increase for utility operating expenses each year were drawn from university budgets over previous years, and annual GHG emissions were obtained from campus inventories.
[33]. We have also assumed that because our university has a robust campus sustainability department to implement a program such as this, the overhead for implementing this program is largely covered and most of the investment results in fixed capital. Reducing utility expenditures as we have modeled would also take place on a relatively static campus environment, with no additional buildings or growth in the student body.
[34]. These considerations have also reflected a relative level of uniformity around reported operational budgets. Many campus budgets are likely to be more nuanced than reflected because endowment earnings will be channeled toward capital projects, research funding, or student support that may not be immediately apparent in operational budgets.
[35]. A bearish period for energy driven by Saudi Arabia’s geopolitically focused energy policy along with broader deflationary trends and sluggish demand growth.